
July 27, 2026
The 2027 ACA Numbers Are Out. Your Max Out-of-Pocket Just Jumped 13%.
The IRS and CMS just finalized the numbers that will govern ACA marketplace coverage for 2027. If you are retired before 65 and buying your own health insurance, these numbers set your premium and your worst-case medical bill for the year. Most of the coverage on this update focuses on the premium side, which barely moved. The number that actually matters more is buried further down the page.
The maximum out-of-pocket ceiling on a standard Silver plan rose about 13% in a single year. That is not a typo, and it is not close to general inflation. Two case studies below show exactly what that means in dollars for a single retiree and for a couple.
What Actually Changed for 2027
Two separate schedules govern what an ACA marketplace plan costs you. The first is the premium tax credit table, which caps what you pay for the benchmark Silver plan as a percentage of your MAGI. The second is the out-of-pocket schedule, which sets the maximum deductible and total exposure the insurer can charge you before covering everything.
The premium table moved the way it usually does. Every bracket rose by roughly 2.4% to 2.9%. At the low end, near 100% of the federal poverty level, the required contribution went from 2.10% of MAGI to 2.15%. At the high end, near 400% of FPL, it went from a flat 9.96% to 10.22%. Small, steady, easy to plan around.
The out-of-pocket ceiling did not move the way it usually does. For a standard Silver plan with no cost-sharing reduction, the individual maximum out-of-pocket rose from $10,600 in 2026 to $12,000 in 2027. For a family, that is $21,200 to $24,000, a $2,800 increase in one year. That is a 13.2% jump, well above general healthcare inflation, and it applies whether you use a dollar of medical care that year or not. It is exposure, not a bill you are guaranteed to pay, but it is exposure that got meaningfully worse overnight.
None of this changes the more important fact for early retirees. The enhanced ACA premium tax credits from 2021 through 2025 already expired at the end of last year and Congress did not renew them. The 400% FPL hard cliff, where the entire subsidy disappears the moment you cross the line, is back and applies in 2027 exactly as it did before those credits existed. Nothing in the 2027 update softens that. If anything, a higher out-of-pocket ceiling raises the stakes of staying under that line, since the plan you are protecting with the subsidy now has a bigger worst case behind it.
Case Study: Elaine, Living on $47,000 a Year
Elaine retired at 60 and lives on withdrawals from her 401k and brokerage account. Her MAGI runs about $47,000 a year, which for a single person sits comfortably above the 250% FPL cost-sharing cliff but well under the 400% FPL subsidy cliff. She is on a standard Silver plan with no cost-sharing reduction.
In 2026, her subsidized premium runs $4,680 a year, and her maximum out-of-pocket exposure on top of that is $10,600. Worst case, a bad health year could cost her $15,280 total.
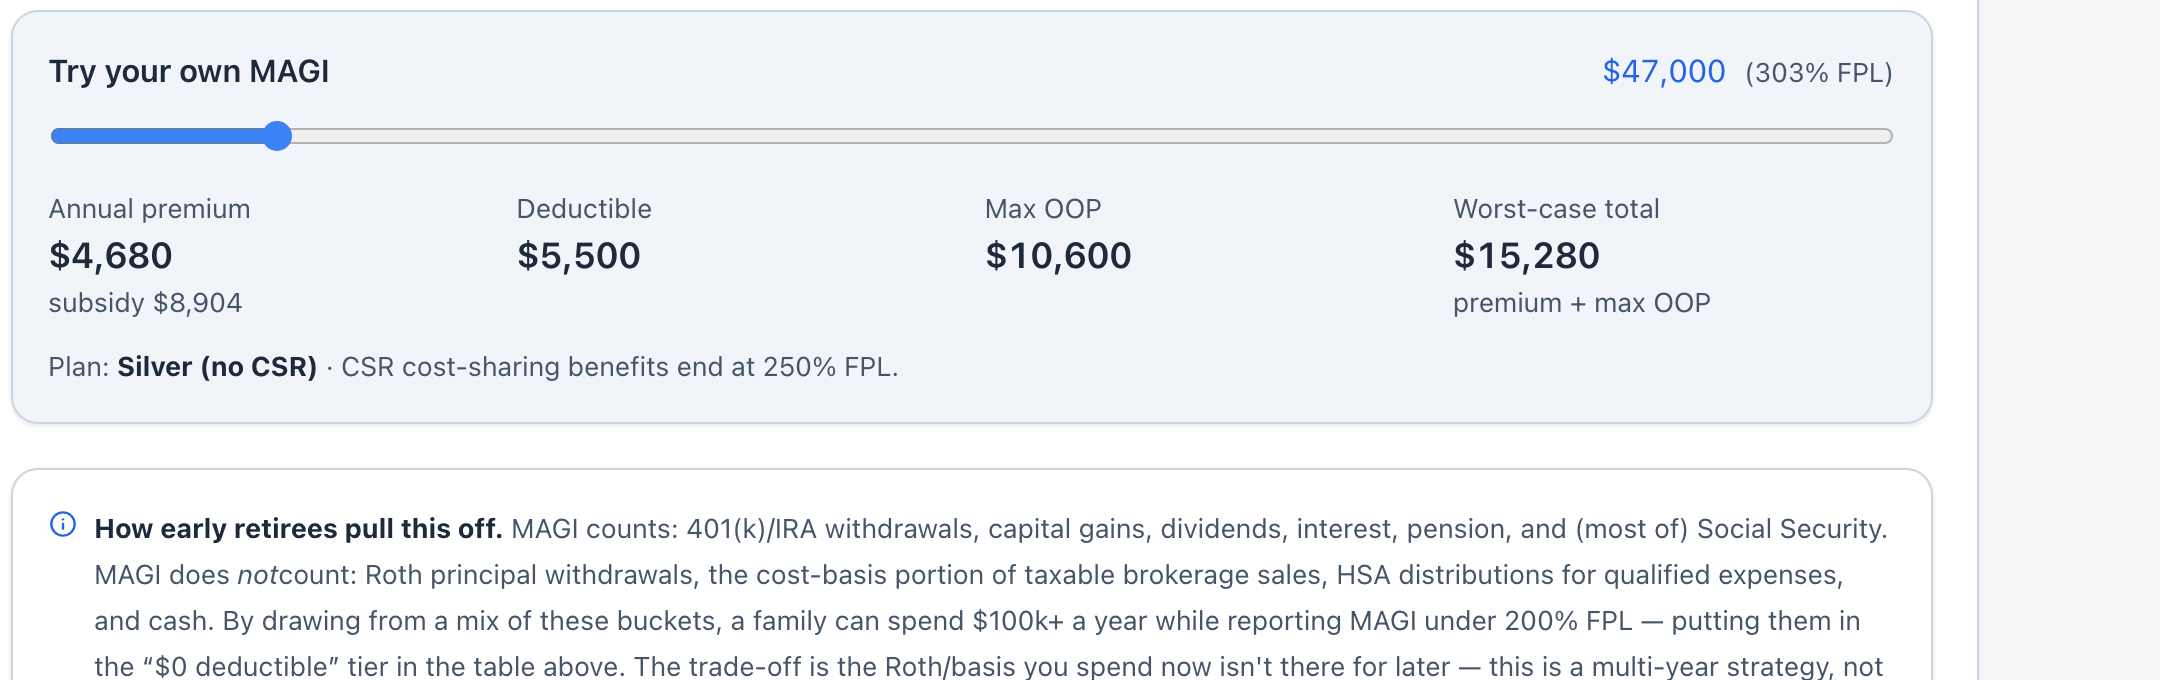
Run the same $47,000 MAGI through the 2027 numbers and her premium barely moves, up to $4,728. But her maximum out-of-pocket jumps to $12,000. Her worst-case total for the year climbs to $16,728, about $1,448 higher than 2026, almost entirely from the out-of-pocket change rather than the premium.
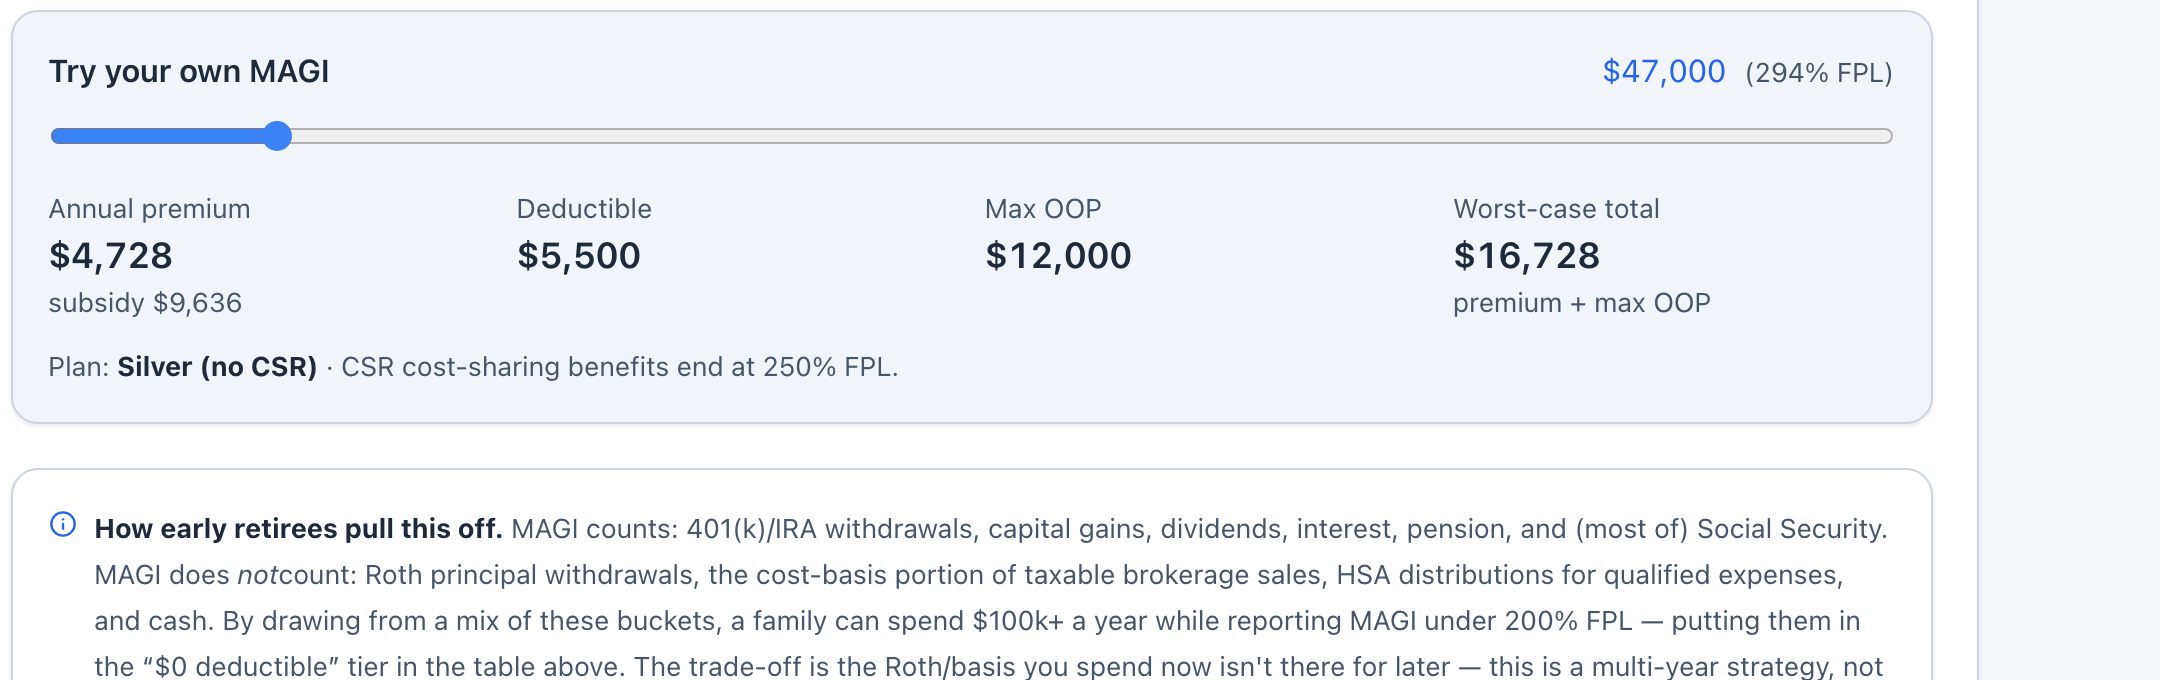
Nothing about Elaine’s income or her plan choice changed between these two screenshots. The only thing that moved is the calendar.
Case Study: Renee and Marcus, a Couple Bridging to Medicare
Renee and Marcus retired together in their early sixties. Between Renee’s old 401k and a taxable brokerage account, they report a household MAGI of $60,000, which for a family of two also lands them in the standard Silver tier with no cost-sharing reduction.
In 2026, their premium runs $5,712 a year after subsidy. Their maximum out-of-pocket, at the family level, is $21,200. Worst case for the year is $26,912.
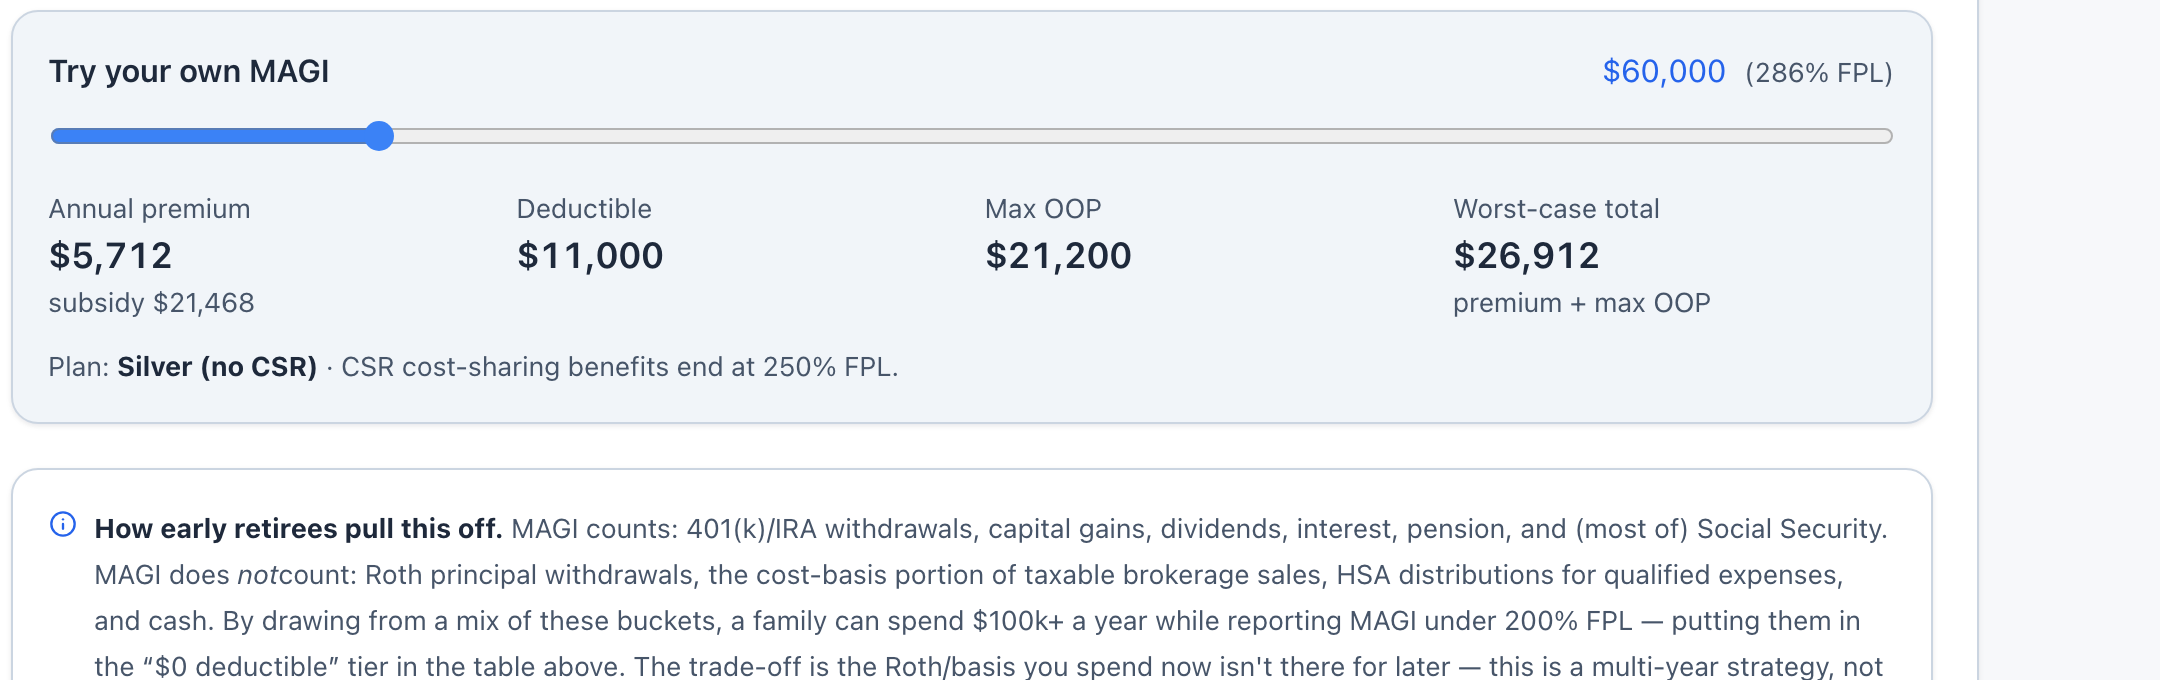
Move to 2027 with the same $60,000 MAGI and their premium is, almost by coincidence, the exact same $5,712. Their share of the poverty line eased slightly as the FPL figure itself rose, which offset the higher premium percentage. But their maximum out-of-pocket rises to $24,000, a $2,800 increase, since the family cap is simply twice the individual figure. Their worst case for the year climbs to $29,712.
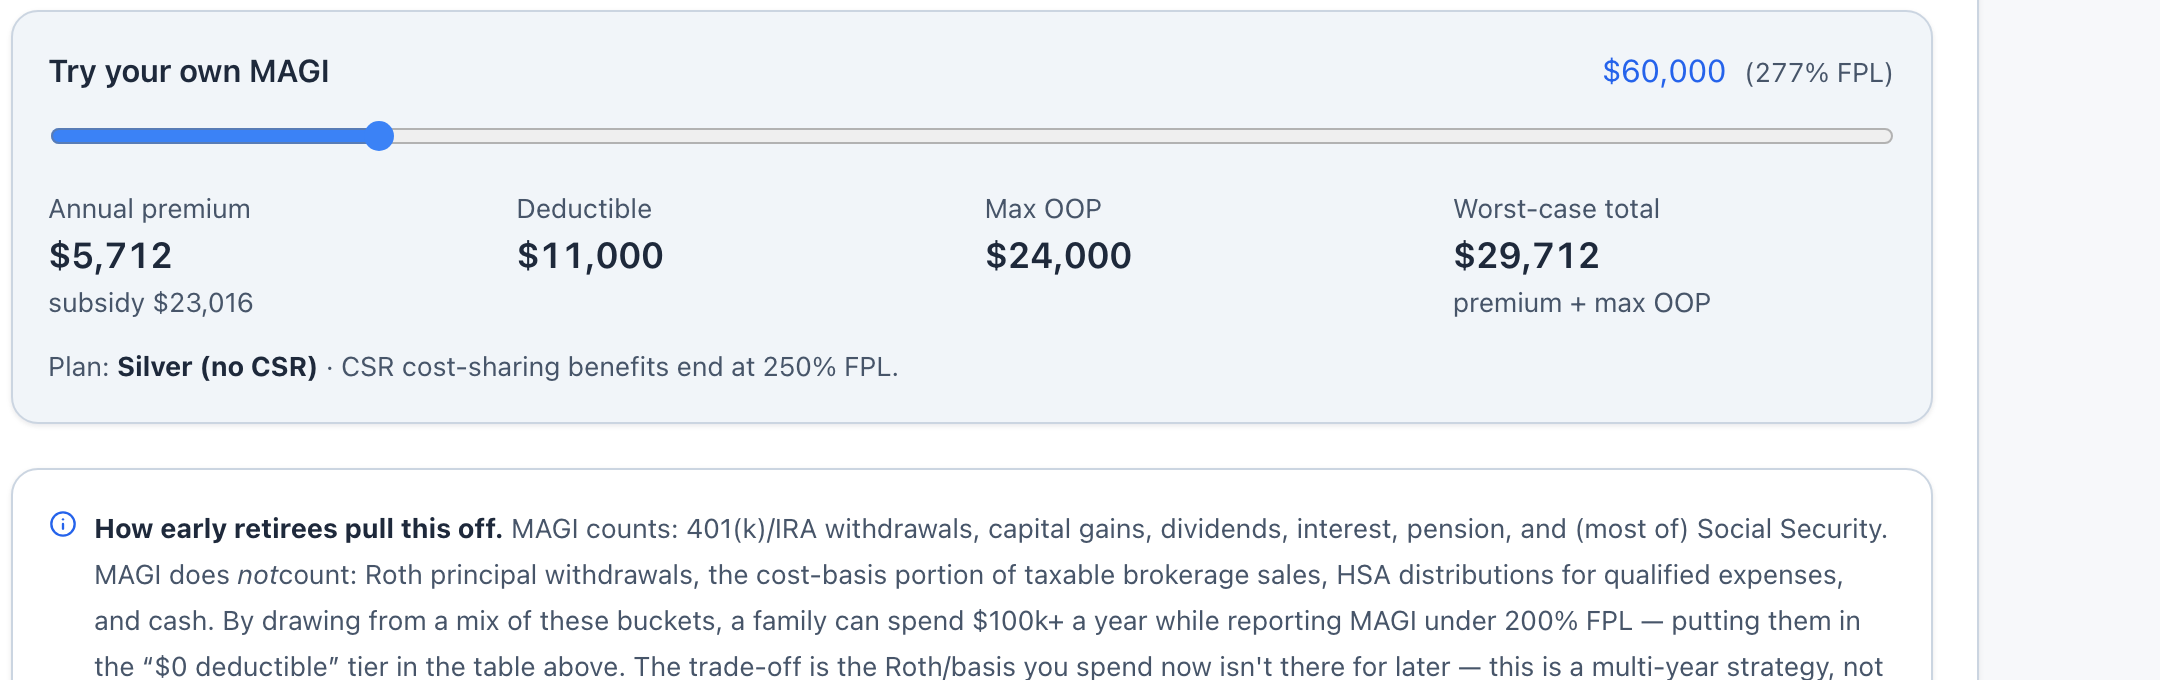
For a couple bridging several years to Medicare, that $2,800 is not a one-time event. It resets every year the out-of-pocket schedule climbs, and it stacks on top of whatever premium changes happen alongside it.
Why the Out-of-Pocket Number Deserves More Attention Than the Premium
Premium increases get attention because they hit every month, whether or not you use your insurance. A 2% or 3% premium move is easy to notice and easy to shrug off. Out-of-pocket ceilings are different. They are invisible in a healthy year and enormous the one year you actually need care, which is exactly the scenario the maximum is designed to protect you from having no limit at all.
A 13% jump in that ceiling in a single year means the protection you were counting on is 13% thinner than it was twelve months ago, for the exact same income and the exact same plan tier. If you built a bridge-year budget around the 2026 worst case, that budget is now short by the difference, and the only way to know by how much is to run your own numbers through both years rather than assume last year’s figure still applies.
Check Your Own 2027 Numbers
The ThunderHarbor ACA subsidy calculator uses the current applicable-percentage table and the current out-of-pocket ceilings, not last year’s numbers. Enter your age, household size, and MAGI to see your premium and your worst-case exposure for the year you are actually planning around.
For the full picture of how a Roth conversion interacts with the 400% FPL cliff during your bridge years, the post on Roth conversion strategy for early retirees walks through the trade-off in detail. For the other income cliffs that stack on top of the ACA one, including IRMAA and the tax bracket ceiling, see Retirement Income Has Cliffs.
Not financial advice
This article is for informational purposes only. Nothing here constitutes financial, tax, or legal advice. Elaine, Renee, and Marcus are illustrative profiles, not real people. ACA subsidy and out-of-pocket rules change from year to year. Always consult a qualified professional and verify current figures at Healthcare.gov before making coverage decisions.
See your 2027 ACA numbers, not last year’s
ThunderHarbor models your ACA premium, out-of-pocket exposure, and subsidy cliff year by year through your full bridge to Medicare, using the current rules for each year, not a single frozen table.
Check my ACA costs