
October 8, 2026
Today Has No Precedent. History Still Shows You What to Prepare For.
Stock prices sit close to where they stood at the 2000 peak. Interest rates and inflation are not where the last decade left them. Nobody can tell you what happens from here, and no record of past retirements matches this start. History still shows how plans break, and once you know how a plan breaks, you can check your own and decide what you will do about it.
What history can and cannot say about a start like this one
The usual measure of how expensive stocks are is the CAPE ratio, price divided by ten years of average earnings after inflation. Our reading for early October 2026 is about 42. The highest month in Robert Shiller's data is December 1999, at about 44.
We took every possible start year in Shiller's data and ran the same retirement through each. It started with $1 million in a 60/40 mix of stocks and bonds, took out $40,000 in the first year, raised that with inflation after that, ran 30 years, and charged 0.1% in fees. Everything is in today's dollars and the data runs through 2022. Then we grouped the starts by how expensive stocks were on day one.
| Starting CAPE | 30-year starts | Lasted 30 years | Starts that ran out |
|---|---|---|---|
| Under 15 | 56 | 56 (100%) | none |
| 15 to 22 | 51 | 48 (94%) | 1967, 1968, 1969 |
| 22 to 28 | 6 | 4 (67%) | 1965, 1966 |
| Above 28 | none yet | none yet | none yet |
The bottom row is the one that matters, and it is easy to misread. It does not say that high starts fail. It says there is no finished 30-year case to look at. The only starts above 28 are 1997 to 2002 and 2017 onward, and none of them has had 30 years yet. The six starts from 1997 to 2002 have each run 20 years, and all six held. Those years included two large crashes. They also included a long bull market that nobody was promised.
So history gives no warning here and no reassurance. It is silent. A plan that depends on the answer being good is a bet. A plan that works across a range of answers is a plan.
What history does teach about how a plan breaks
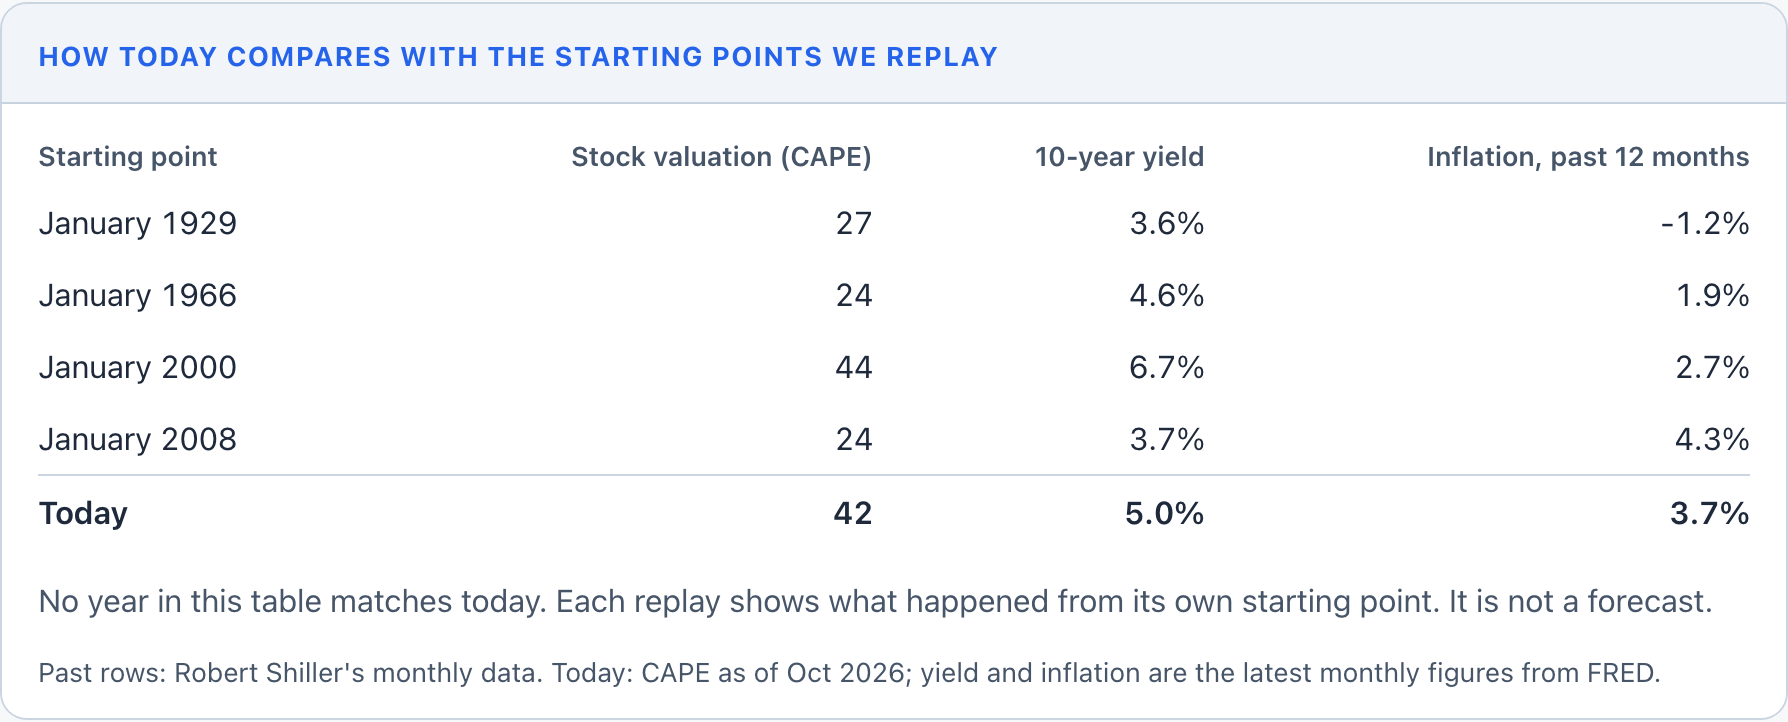
Look at the two starts that failed in the middle row. January 1966 did not look like trouble. Inflation was 1.9%. The ten-year yield was 4.6%. Stocks were expensive but not extreme. What followed was 17 years (1966 through 1982) in which stocks returned about 0% a year after inflation, bonds lost about 1.3% a year after inflation, and prices rose 6.9% a year on average. A retiree who kept raising withdrawals with prices ran out of money in 1990 or 1991.
From 1982 through 1999, stocks returned about 14.7% a year after inflation. The same portfolio, the same withdrawals, a completely different outcome. The difference came from the first stretch, while money was coming out, with flat returns and rising prices and no single crash to point to.
That is the risk worth knowing. It has two ingredients that can show up in any year, including this one. Returns can come in lower than you assumed, and prices can rise faster than you assumed. Add the two ways a plan gets hurt on day one, a drop in what you own and spending that runs higher than you planned, and you have the four tests below.
Four tests that turn the risk into numbers
ThunderHarbor's Your retirement edge card, the first card on My Retirement, runs your own plan through one change at a time. The changes are returns 2 points lower every year, inflation 1.5 points higher every year, account balances 20% lower today, and spending 10% higher every year. It uses your real accounts, taxes, pensions, and Social Security. For each change it says whether your money still lasts to age 95. If it does not, it says how long it does last. The premium table on Risk Analysis goes further and shows how far each input can move before the plan stops lasting.
The sizes are round numbers we chose, and they say nothing about what is likely. Their job is to measure every plan against the same four nudges so you can see which one gives way first.
Here is what that looks like for two couples who both retired this year. They have the same assumptions, with 70% in stocks, a 7% yearly return from stocks, and 3% inflation. They live in the same market. Their plans have different room.
Walt and Joan have a lot of room
Walt and Joan are both 60 and live in Pennsylvania. They have $1.98 million, most of it in a traditional 401k. They spend $90,000 a year and plan to claim Social Security at 70. Their money lasts to 95 on their assumptions, and it still lasts under all four tests.
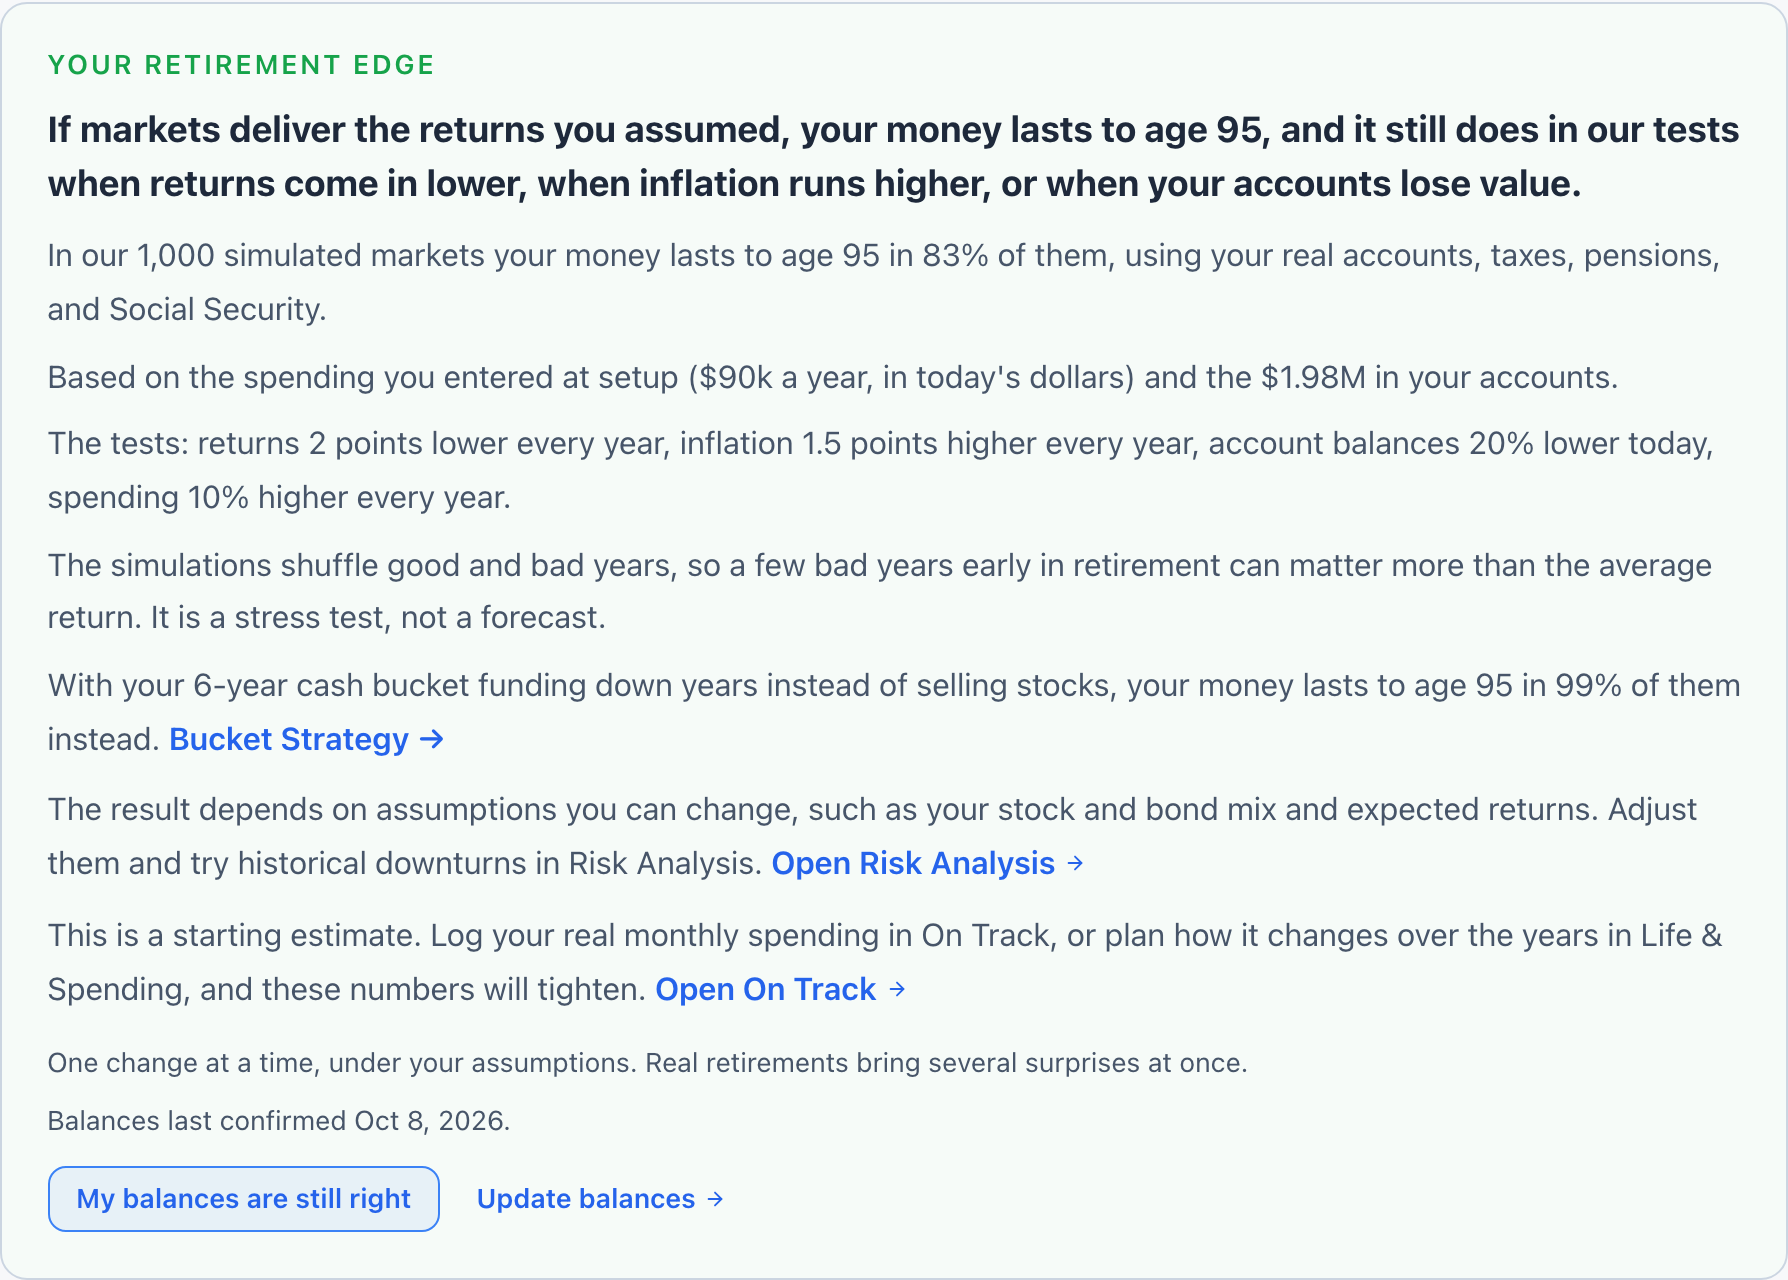
The full table shows how large their margins are. Their balances would have to fall about 29%, to about $1.40 million, before the plan stops lasting to 95. Their spending would have to rise about 26%, to about $113,000 a year. Returns would have to come in about 2.6 points lower every year. For them, a rough decade is something to watch.
Ray and Nadia have almost none
Ray is 62 and Nadia is 61. They live in Texas and have $2.41 million, including $800,000 in a taxable account. They spend $150,000 a year and plan to claim Social Security at 67. Their money lasts to 95 on their assumptions. It is also the plan that looks the safest on a plain balance, since $2.41 million is more than Walt and Joan have.
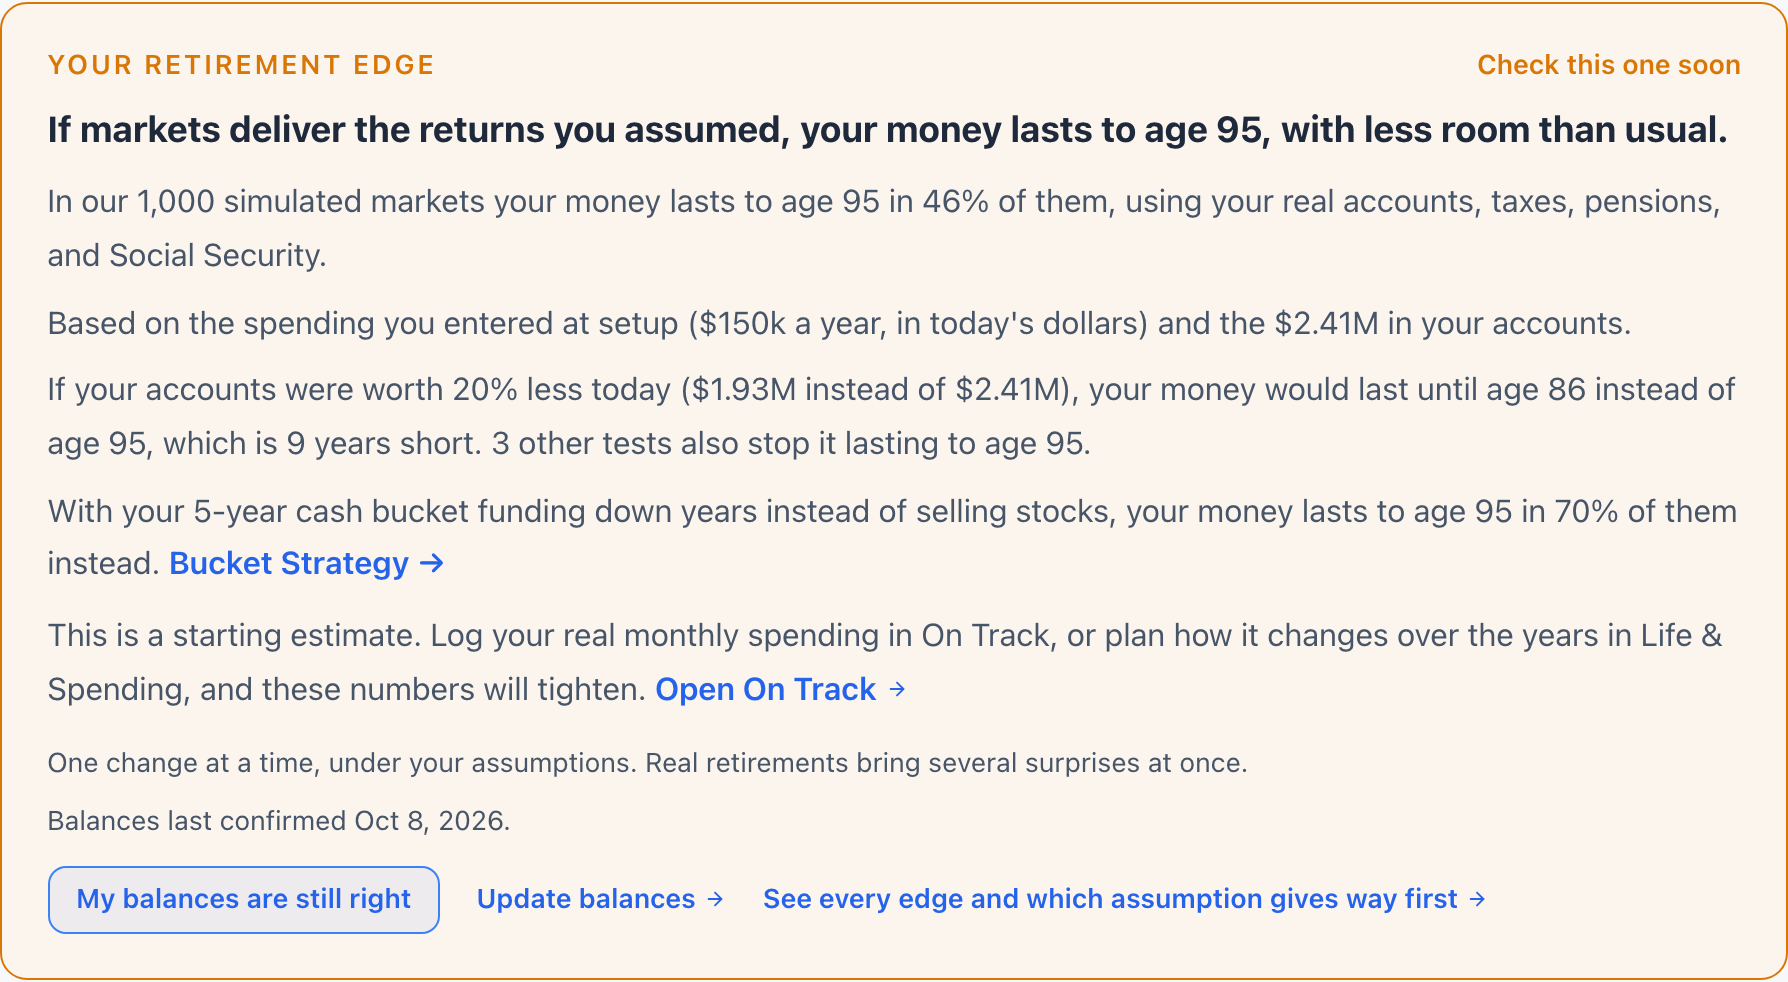
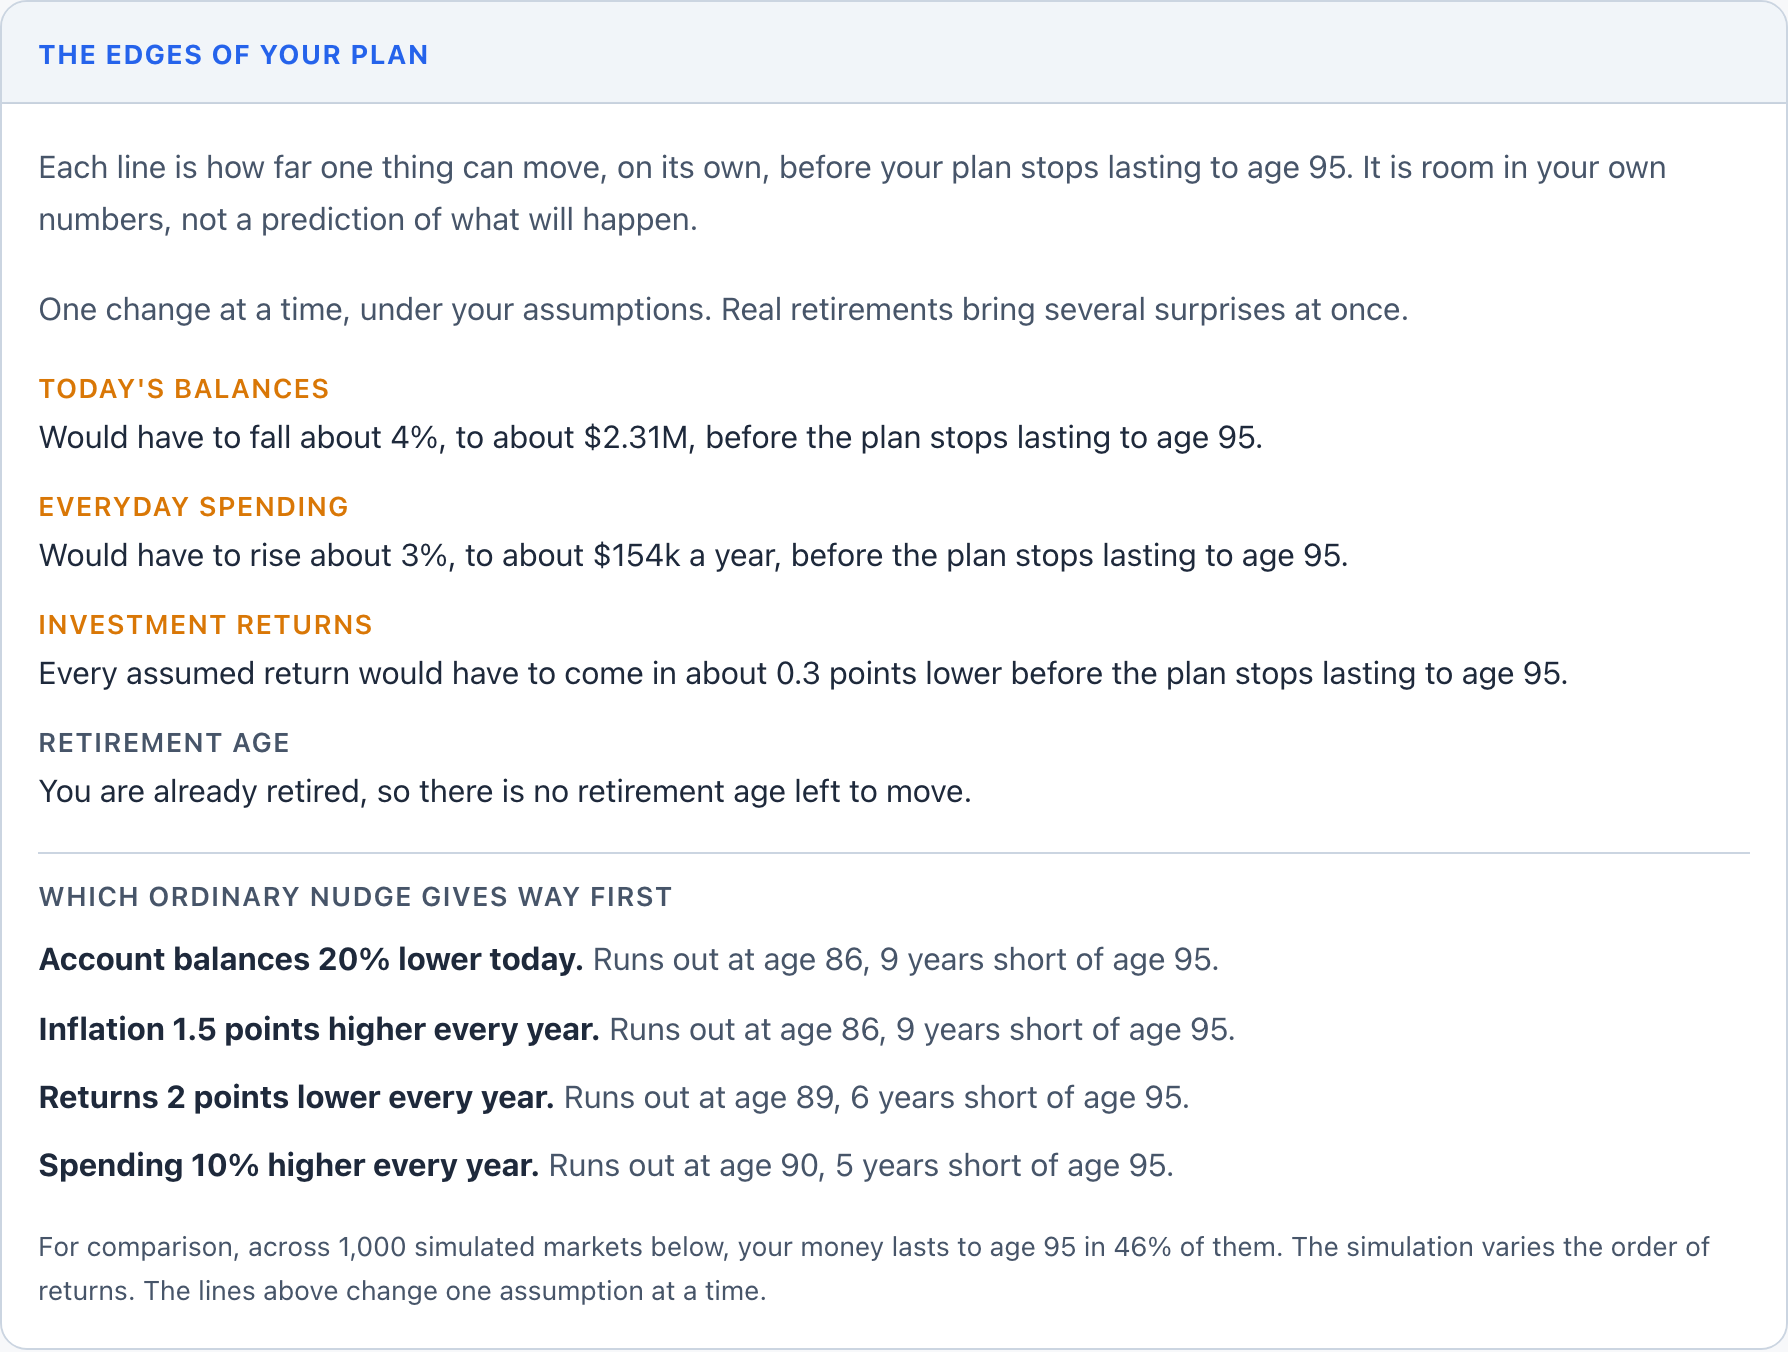
Every one of the four tests breaks their plan. A 20% lower balance runs out at 86. Inflation 1.5 points higher runs out at 86. Returns 2 points lower runs out at 89. Spending 10% higher runs out at 90.
Same market, different thing to watch
| Margin before the plan stops lasting to 95 | Walt and Joan | Ray and Nadia |
|---|---|---|
| Savings and spending | $1.98M, $90k a year | $2.41M, $150k a year |
| Balances can fall | about 29%, to $1.40M | about 4%, to $2.31M |
| Spending can rise | about 26%, to $113k | about 3%, to $154k |
| Returns can come in lower by | about 2.6 points | about 0.3 points |
| Four tests that break the plan | 0 of 4 | 4 of 4 |
Two different households face the same headlines and need two different answers. Walt and Joan do not need to follow the market. Ray and Nadia need a plan for what they will do if the next few years are flat and prices keep climbing, and they need it before they are in it.
That is what knowing the risk buys you. We ran Ray and Nadia again with lower spending. A 10% cut, to $135,000, helps but does not fix it. The worst test now runs out at 90 instead of 86, and three of the four still break. A 20% cut, to $120,000, passes all four. Nobody has to cut spending today. The point is that they now know which lever moves their plan, how far it needs to move, and what the trigger would be.
If you retire in a year or two, watch one number
Before you retire, the same table turns into a line on your own statement. For a single filer who is 62, has $1.52 million, spends $70,000 a year, and plans to retire at 65, the plan stops lasting to 95 only if today's balances fall about 46%, to about $822,000. On today's numbers, even retiring right now would last. That person can ignore a bad quarter and watch one number.
Someone with a thin margin does the opposite. They know the balance below which retiring on schedule stops working, and they check their own account against that number instead of watching a market index. The line moves with the plan, so it only helps if the balances behind it are current. That is why the card shows when you last confirmed them, and why there is a button, My balances are still right, for the days when nothing changed.
How to prepare without predicting
- Replace setup guesses with real spending. The card says what it rests on. Logging your actual monthly spending in On Track makes the margins tighter and more honest.
- Find which test gives way first. If balances, inflation, returns, and spending all hold, you have room. If one breaks, that is the one to work on.
- Decide your response now. A spending cut, a cash reserve for down years, a different Social Security age. The What-If Workshop and the Bucket Strategy tab let you try each against your own plan before you need it.
- Keep the inputs current. Confirm your balances when nothing changed and update them when something did. We send a short reminder email when it has been a while.
- Do not trade on headlines. ThunderHarbor does not follow the market and does not update daily. The valuation reading comes from a hand update. A plan with room does not need a live feed.
What these tests cannot do
They change one thing at a time, and real retirements bring several surprises at once. They use one inflation rate for every year of the plan, so a 1970s-style stretch is approximated by raising that rate for the whole plan, which leaves out a sharp spike. And the stress sizes are our round numbers, and they say nothing about how likely any of them is. The simulation on Risk Analysis adds the order of returns, which a single stress test cannot show. Use all of it to see room and risk in your own numbers.
Not financial advice
This article is for informational purposes only. Nothing here constitutes financial, tax, or legal advice. The households are hypothetical. The historical figures come from Robert Shiller's data through 2022 and describe what happened. They do not predict what will happen. Your own spending, income, and goals change the answer. Talk to a qualified professional before you change your plan.
See how much room your own plan has
The Your retirement edge card on My Retirement runs these four tests on your plan. It is free. Premium adds the full margins table on Risk Analysis.
Start your free plan