June 20, 2026
What Spreadsheets, AI, and Retirement Calculators All Miss
Most people start with a spreadsheet, move to an online calculator, and eventually try asking an AI. Each step feels like an improvement. The problem is that all three tools share the same blind spots.
The gaps are not about missing a feature. They show up because retirement math is multi-layered. Several tax rules can land on the same dollar of income in the same year, and the combined effect is often far larger than any one rule in isolation. The six categories below are where that gap between what a tool shows you and what is actually happening tends to be the most expensive.
The Tools Most People Try First
When a generic calculator feels too simple, most people try one of two things. They build a spreadsheet, or they start asking an AI. Both feel like progress. Both run into the same wall.
A spreadsheet is two-dimensional. It has rows and columns. Retirement math is not. In any given year, four or five separate tax rules may all apply to the same dollar of income at the same time. A spreadsheet can put each rule in a separate cell, but it cannot show you how they interact without manual work that most people never do. Even if you build the model correctly on day one, maintenance catches up with you. Every time your spending changes, inflation assumptions shift, or you add a one-off expense like a car or a home repair, you are rebuilding formulas. Most people update their retirement spreadsheet two or three times and then stop. A plan that was accurate in January may be silently wrong by July, and you would not know it.
AI has a different problem. To get a useful answer, you need to ask the right question. That requires already knowing what to look for. If you do not know that IRMAA exists, you will not ask about it. As the conversation grows longer and you add more details, the numbers tend to drift. Earlier inputs get lost. The same prompt run twice in separate sessions may produce different answers. AI is genuinely good at explaining how a concept works. It is not reliable for running the specific numbers behind a plan you are going to retire on.
The six gaps below show where things tend to break down, regardless of which tool someone is using.
1. Tax-Exempt Income That Still Raises Your Medicare Bill
Municipal bond interest is federally tax-free. That part most people know. What most people do not know is that it still counts toward the income calculation Medicare uses to set your Part B and Part D premiums, called IRMAA. If your income crosses certain thresholds, Medicare charges you a surcharge on top of the standard premium. The first IRMAA tier in 2026 adds roughly $70 per month per person, or about $840 per year. For a couple, that is $1,680 per year, every year, for the rest of their lives.
Consider Linda, who is 68 and holds $400,000 in municipal bonds yielding 3 percent. That is $12,000 per year in interest she never reports as income on her federal return. She spent years parking money in munis specifically to reduce her tax bill, and it worked. But when her planner runs her Medicare projection, it uses only her taxable income and shows her comfortably under the IRMAA threshold. The $12,000 in muni interest never appears in the model.
In reality, that $12,000 is added back into the MAGI calculation Medicare uses, which is the rule most software ignores. Combined with her Social Security and a small pension, it pushes her $8,000 above the first IRMAA tier. She pays the surcharge. Over 20 years, that quiet assumption costs her more than $33,000 in premiums she thought she had planned her way around.
The same applies to ACA subsidies during the bridge years before Medicare. Tax-exempt interest counts toward the income figure ACA uses to set your subsidy. Ignore it, and your subsidy estimate is too generous. See it correctly, and you might restructure your bond holdings or adjust your Roth conversion target before committing to a plan.
2. Rental Income Rules That Change Above $150,000
A lot of retirees carry rental property into retirement. Some use it as income, some as a long-term asset, and many have a mix of both. What almost no generic retirement calculator models correctly is the IRS passive activity loss rules that govern what you can actually do with a rental loss in a given year.
Here is how the rules work. If your rental expenses, including depreciation, exceed your rental income, you have a passive loss. For active participants, the IRS allows you to deduct up to $25,000 of that loss against ordinary income. But the allowance phases out between $100,000 and $150,000 of MAGI. Above $150,000, the deduction is zero. Your loss does not disappear. It suspends and carries forward to future years or until the property is sold.
Consider Robert, who is 65 and collects $28,000 per year in rental income with $34,000 in total expenses including depreciation. Net rental loss: $6,000 per year. In the first years of his retirement, his income is modest and he falls under the $100,000 threshold. He deducts the full $6,000 and reduces his taxable income by that amount each year. His calculator shows a clean result.
Then at 73, his RMDs begin. His income jumps above $150,000. The deduction goes to zero. Those suspended losses start stacking up. A projection that does not track this shift year by year will overestimate his after-tax income in the early years and underestimate his tax bill when RMDs arrive. The resulting plan is built on the wrong numbers from the start.
Rental income that counts toward MAGI also affects ACA subsidy eligibility, IRMAA tier placement, and how much room remains for a Roth conversion in any given year. All of those interactions need to be modeled together, not as separate independent calculations.
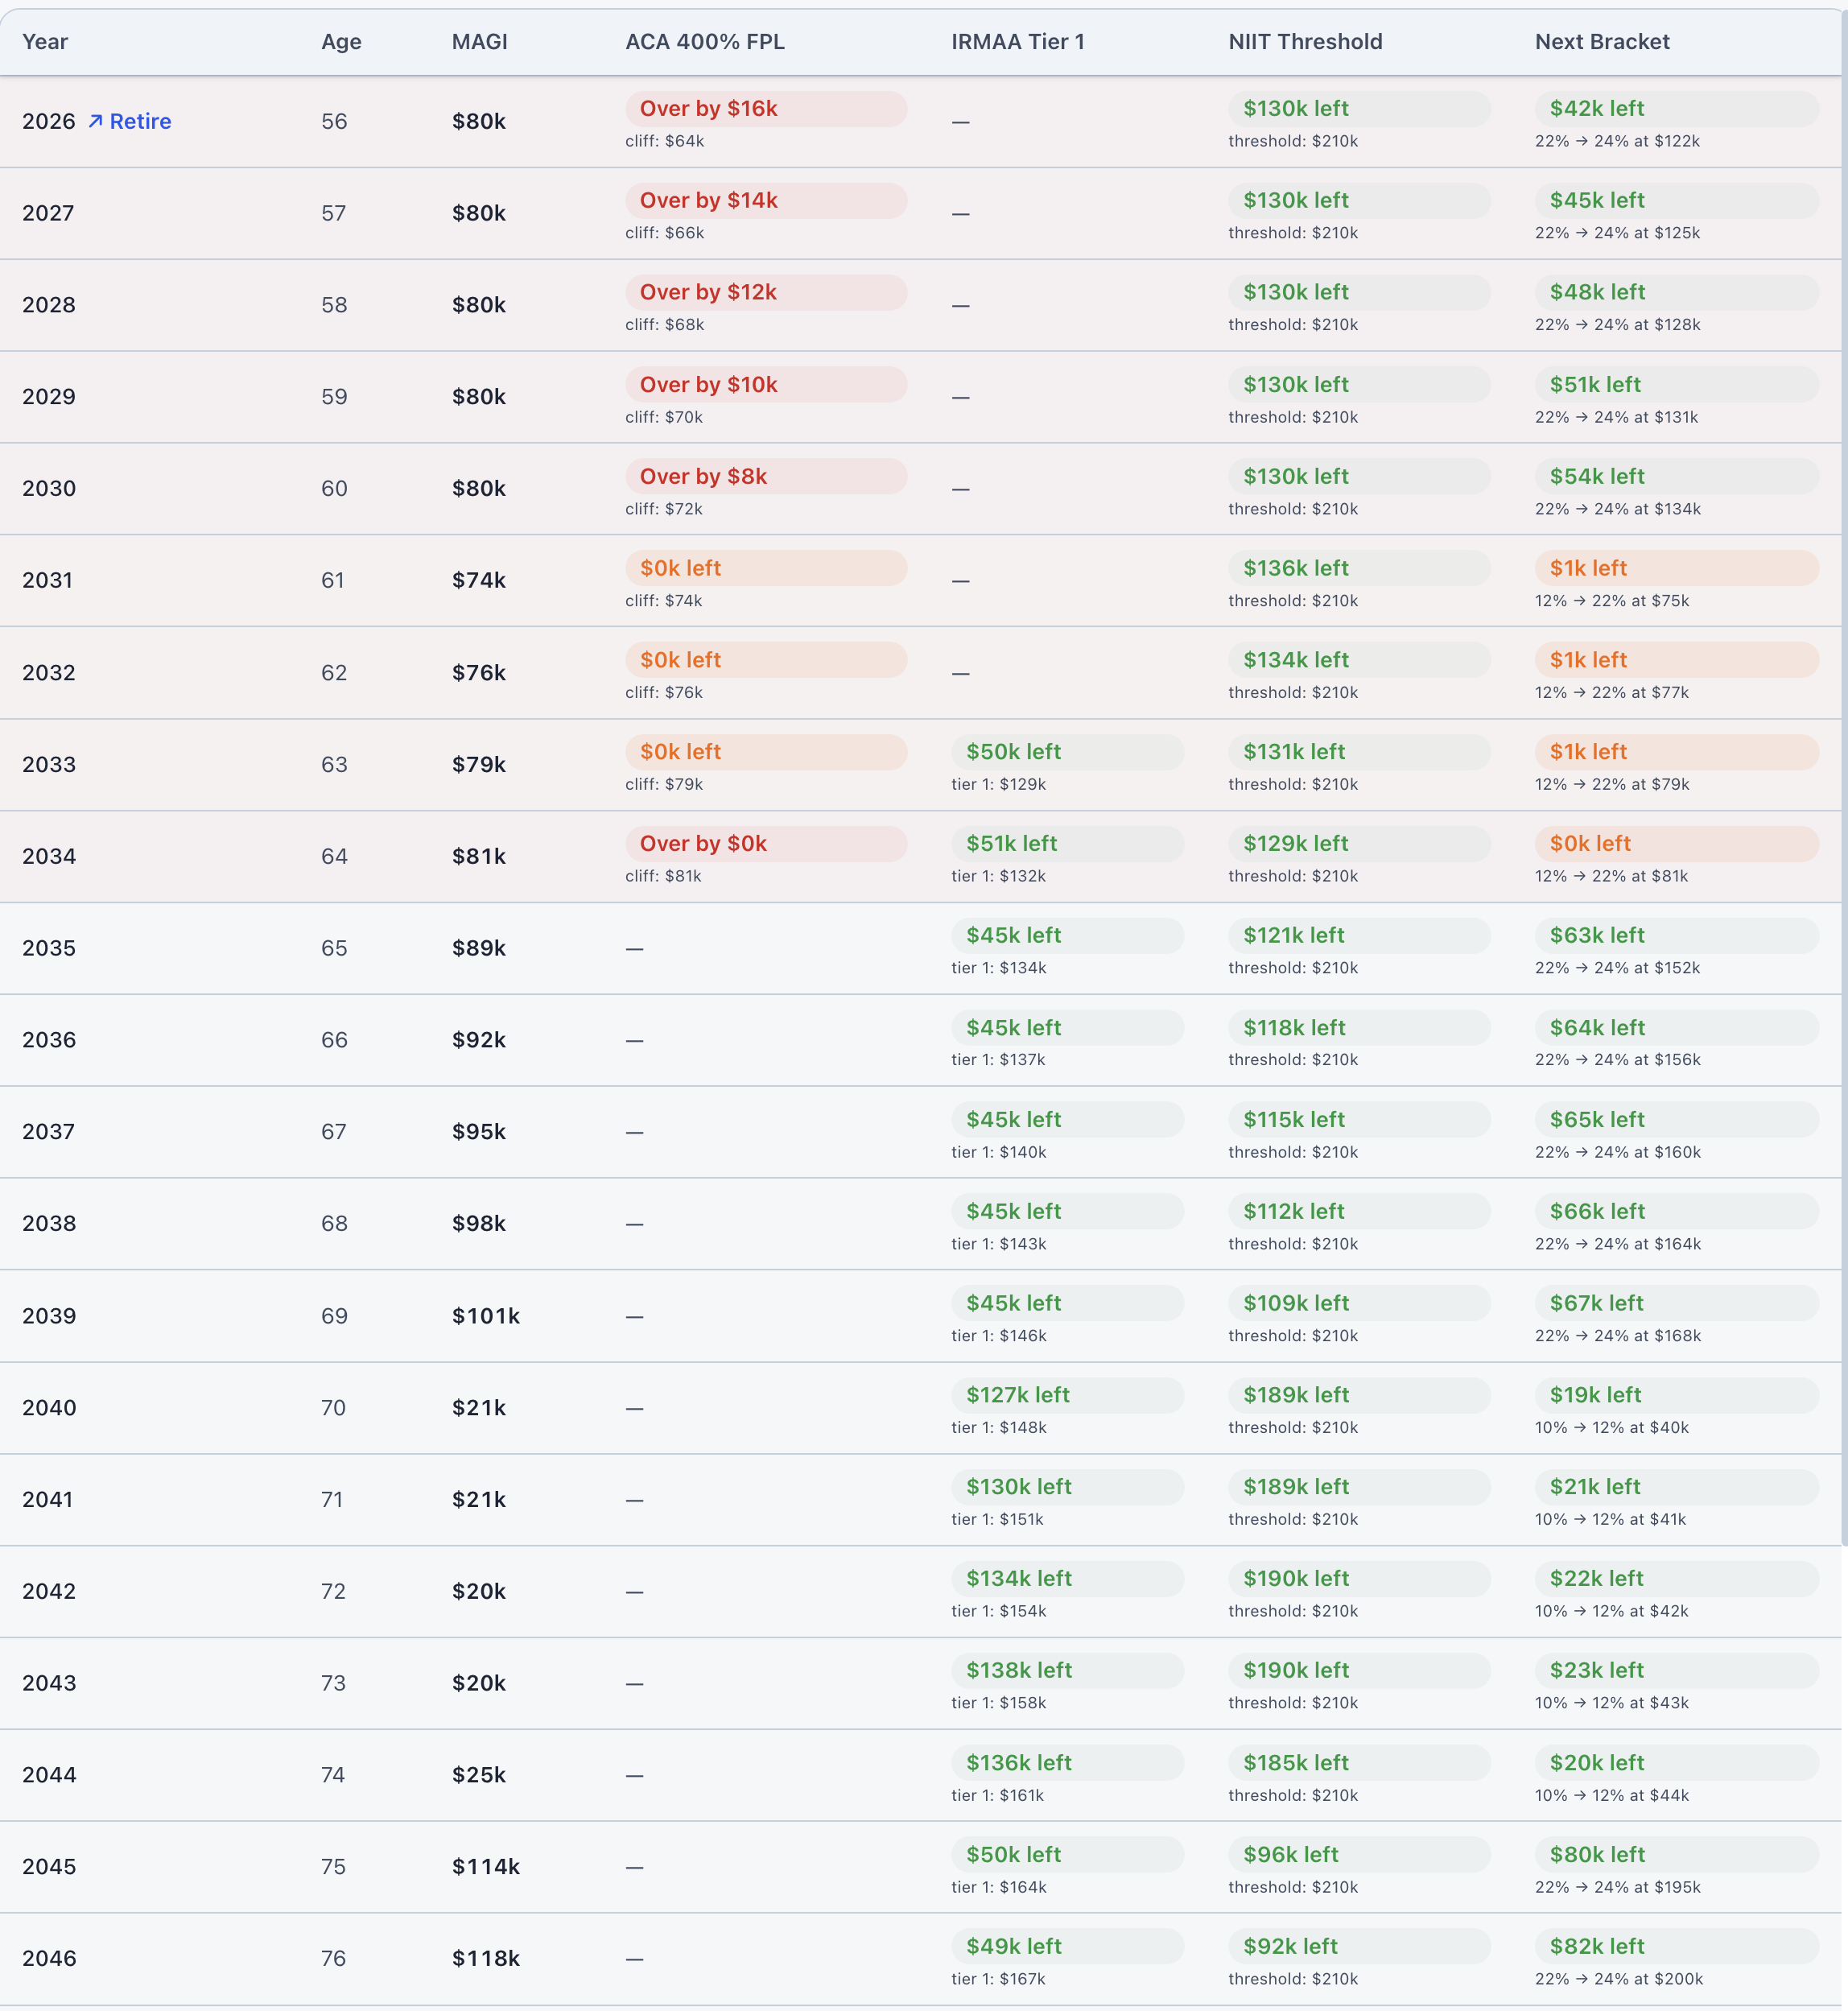
3. Four Tax Cliffs That Can Hit the Same Dollar
In retirement, your income is governed by at least four separate income thresholds, each with its own rules, its own phase-in, and its own penalty for crossing it. The ACA premium cliff cuts off your health insurance subsidy. IRMAA adds Medicare surcharges at five different income tiers. The Social Security provisional income calculation determines how much of your Social Security benefit is taxable, jumping from 50 percent to 85 percent at a specific threshold. The Net Investment Income Tax, a 3.8 percent surcharge on investment income, applies above $200,000 for single filers.
The problem is that most calculators show you one of these at a time, if they show any of them at all. What you actually need to see is where all four thresholds fall relative to your projected income, across every year of your retirement, on a single chart. The reason is that a Roth conversion, a large withdrawal, or even a part-time consulting payment can cross multiple cliffs simultaneously. The combined effect is often four or five times larger than any single cliff alone.
A retiree who converts $40,000 in the wrong year might push past an IRMAA tier, cross the Social Security 85 percent threshold, and lose a significant chunk of an ACA subsidy, all from one decision. That combined cost is easily $8,000 to $15,000. Seeing the cliffs individually does not tell you that. Seeing them side by side against your actual projected income does.
The other thing a combined view shows is the years with genuine room. There are often windows, sometimes lasting two or three years, where your income sits comfortably below every major threshold at once. Those are your best Roth conversion years. They are hard to find without a chart that shows you all four thresholds at the same time. With one, they are obvious.
4. The Cash Buffer Math That Most People Have Never Seen
Sequence of returns risk is the risk that bad market years happen early in your retirement, when your withdrawals are the most destructive. It is well understood in theory. What is less understood is how large the difference actually is between selling during a crash and waiting a year or two to sell.
Here is the arithmetic. If you withdraw $100,000 during a year when markets are down 37 percent, the shares you sell are priced at their crash value. When markets recover, those shares are gone. The future value of what you sold at the bottom is roughly $159,000 at a modest recovery rate. If instead you waited and withdrew the same $100,000 after a 20 percent market recovery, those shares cost you $83,000 in future value terms. The difference between those two withdrawals is $76,000 in lifetime portfolio impact, from a single year of timing.
A cash buffer, typically one to three years of spending held outside the equity portfolio, lets you draw from cash during bad years rather than selling stocks at their worst prices. The bucket refills from equities in up years, when selling costs far less in future value.
The question most people cannot answer is how much this strategy would have actually helped in a real crash. Modeling the 2008 financial crisis, the 2000 dot-com collapse, and the 1929 Depression against a specific retirement plan, with and without a cash buffer, turns the strategy from a general idea into a concrete comparison. The gap between the two lines is usually larger than people expect, especially for retirees who started drawing income within a few years of a major crash.
5. What Your Heirs Actually Keep From an Inherited IRA
The SECURE Act changed the rules for inherited IRAs in 2020. Under the prior law, a non-spouse beneficiary could stretch distributions over their lifetime, keeping the tax-deferred account growing for decades. Under the current rule, most non-spouse beneficiaries must fully deplete an inherited traditional IRA within 10 years. There are no minimum annual withdrawals required, but the full balance must be gone by the end of year 10.
This rule changes the math on leaving a traditional IRA to your children significantly. Consider a woman who passes away at 80 leaving a $500,000 traditional IRA to her son, who is 45 and earns $120,000 per year. To empty the account in 10 years, he takes roughly $50,000 per year, which stacks on top of his existing income. That puts him at $170,000 in combined income for each of those 10 years. The marginal federal rate on that upper portion is 32 percent. State taxes add more. The net result is that a meaningful share of the inheritance goes directly to tax, year after year.
If the same $500,000 had been in a Roth IRA instead, inherited Roth IRAs also fall under the 10-year rule, but the distributions are tax-free. The son still takes money out over 10 years, but he keeps all of it. The difference between a $500,000 traditional IRA inheritance and the same $500,000 in Roth can easily exceed $100,000 in taxes paid by the next generation.
This is one of the strongest arguments for doing Roth conversions in your 60s and 70s that does not show up in a standard retirement calculator. The standard calculator is modeling your retirement. The tax cost of passing a traditional IRA to a working-age child happens after your retirement ends, which means most tools never model it at all.
6. The 72(t) Payment That Looks Simple Until You Model the Full Picture
Section 72(t) of the tax code allows you to take substantially equal periodic payments from an IRA or 401k before age 59½ without paying the 10 percent early withdrawal penalty. This is the main legal route for people who retire in their early 50s and cannot wait until standard retirement account age to access their savings.
The rules are strict. You choose one of three IRS-approved calculation methods, each producing a different payment amount. Once you start, you are locked in for five years or until you reach age 59½, whichever is longer. Modifying the payment amount before that period ends triggers the penalty retroactively on all prior payments. This is not a flexible income stream. It is a commitment.
Consider Carlos, who is 52 and plans to retire this year with $1.2 million in a traditional IRA and another $300,000 in a taxable brokerage account. He cannot touch his IRA without penalty until 59½, which is seven years away. The SEPP rule lets him start distributions now. Depending on which calculation method he chooses and the current IRS interest rate, his required annual payment might land anywhere from $38,000 to $55,000 per year.
That payment is taxable income in the year it is received. It counts toward his ACA MAGI during the bridge years before Medicare. It affects how much room he has for a Roth conversion in those same years. And it reduces the IRA balance at a fixed rate for seven years, which changes his RMD trajectory starting at 75. All three of those effects compound against each other, and none of them appear correctly in a calculator that only models the SEPP payment in isolation.
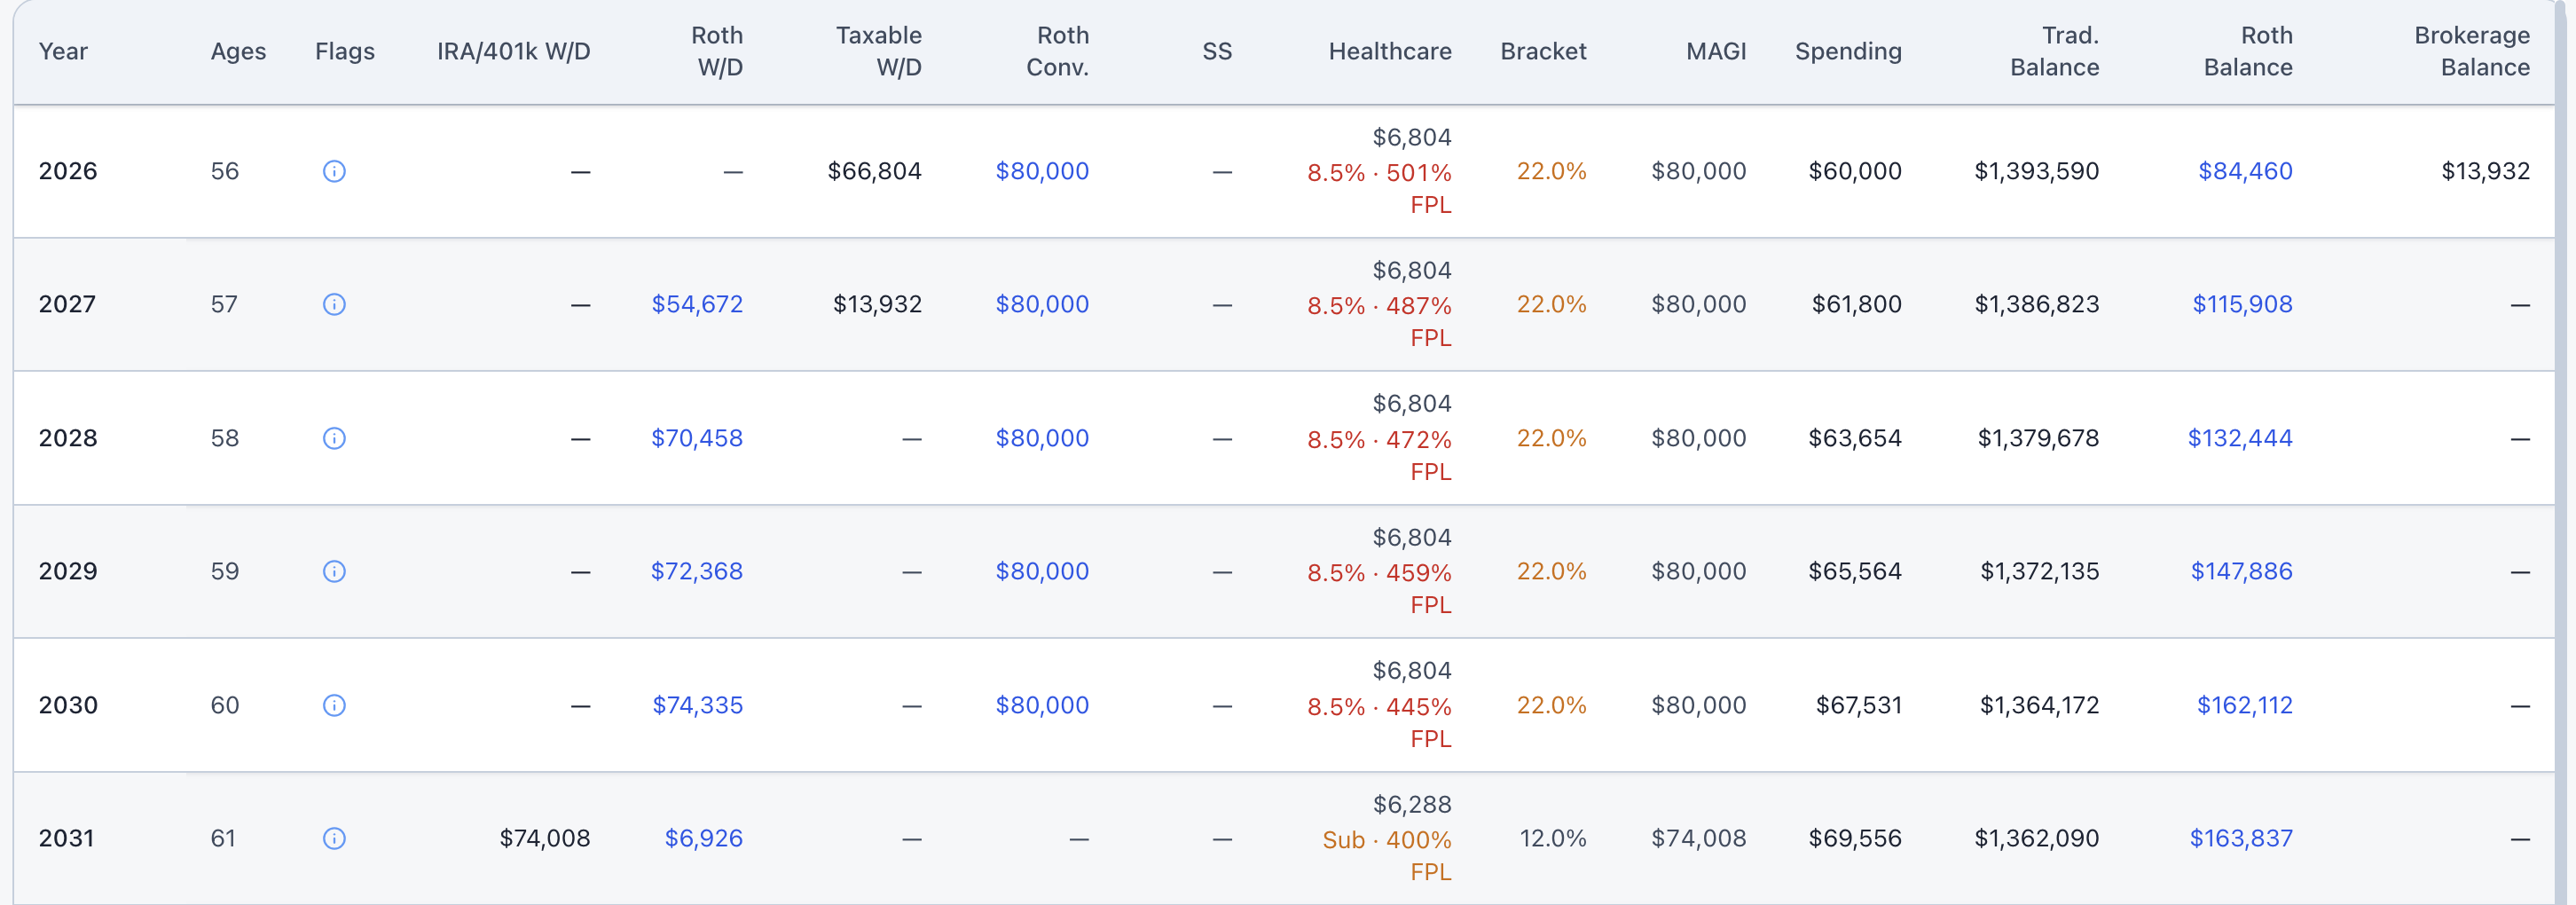
The right question is not just which calculation method produces the best SEPP payment. It is which method, combined with the rest of his income sources, minimizes his total tax bill across the full bridge period while keeping his ACA subsidy intact and leaving room for modest Roth conversions. Those are not four separate questions. They are one question, and the answer requires running all of them together in a single projection.
What These Have in Common
None of these six issues are obscure edge cases. Municipal bonds are extremely common in retiree portfolios. Rental property is one of the most common retirement income sources in the country. The four income cliffs apply to nearly every retiree in some form. Sequence of returns risk is relevant to anyone who draws from an investment portfolio. Inherited IRA rules affect anyone who plans to leave money to the next generation. And early retirement, which means no penalty-free access to retirement accounts for several years, is the exact situation that SEPP exists to solve.
What they have in common is that each one requires the planner to know what happened in a different part of the projection before it can answer the question correctly. They are not independent calculations. They interact, and the interaction is where the money either stays in your pocket or leaves it.
A retirement plan is not a single number. It is a system of rules that all run at the same time. A spreadsheet forces you to maintain that system by hand. An AI may explain the rules but will not apply them consistently to your actual numbers. A generic calculator applies some rules but not all of them. The quality of a planning tool comes down to how many of these rules it actually knows, and how honestly it shows you where they collide. ThunderHarbor models all six of these interactions together, year by year, inside a single projection built around your specific numbers.
Not financial advice
This article is for informational purposes only. Nothing here constitutes financial, tax, or legal advice. Tax rules and income thresholds change from year to year. Always consult a qualified professional before making significant financial decisions.
See how these rules apply to your plan
ThunderHarbor models tax-exempt interest in IRMAA and ACA MAGI, IRS passive activity loss rules for rental income, all four income cliffs on a single chart, historical crash scenarios with and without a cash buffer, inherited IRA depletion tax cost, and SEPP payments inside your full retirement projection.
Start your free plan