
May 13, 2026 · Updated May 16, 2026
How Much Do You Really Need to Retire? Three Real Case Studies
If you have ever Googled how much money you need to retire, you have seen the same three answers. Save $1 million. Replace 80 percent of your pre retirement income. Save 25 times your annual expenses. Each of these is technically defensible. Each of them is also wrong for most of the people who actually use them, because they are answers to a question that ignores all the details that matter. Your actual retirement number depends on what you actually spend, how much of that spending is already covered by Social Security or a pension, and how much of your savings sits in tax sheltered accounts that the IRS still has a claim on. Two people earning the same income, saving at the same rate, planning to retire at the same age, can have wildly different real numbers, sometimes by a factor of two or three.
Why the 80 Percent Replacement Rule Misleads Most Retirees
The 80 percent rule says you need 80 percent of your pre retirement income to maintain your lifestyle in retirement. The intuition behind it is reasonable, you stop saving and you have less spending on commuting and clothes for work, so your needs drop a bit. The problem is that this rule assumes a relationship between your income and your spending that often does not exist.
If you earn $150,000 and you save $35,000 of it, you are already living on $115,000 a year before tax. After payroll taxes, you are actually spending closer to $100,000. In retirement you stop saving entirely, you no longer pay payroll tax on earned income, and a chunk of your work related spending evaporates. Your actual needed income in retirement might be $80,000, which is 53 percent of your old pre retirement income, not 80 percent. The 80 percent rule would tell you to plan for $120,000, which is $40,000 a year more than you actually need. Over 30 years of retirement, that translates to roughly $1 million of overstated portfolio need.
That is not a small error. Telling someone they need $1 million more than they actually need can mean working an extra five to seven years for no reason.
Case Study: A 62 Year Old Who Was Told He Needed $1.5 Million (He Actually Needs $1 Million)
Consider Tom, a 62 year old software engineer earning $155,000. He is thinking about retiring at 65. His wife Linda is 60 and has worked part time for the last decade. They live in a paid off house in a moderate cost area. Their current spending is $7,200 a month, which is $86,400 per year. They have $850,000 saved across his 401k and her IRA.
Tom runs a standard online retirement calculator. It tells him he needs $1.55 million to retire (80 percent of his current income times 25). He is short by $700,000 and the calculator suggests he needs to work another seven to nine years to make up the gap. Tom calls Linda and tells her they need to push retirement to 70 or 72.
This is wrong, and the magnitude of the error matters because it changes their life.
The real calculation goes like this. Tom and Linda actually spend $86,400 a year. After taxes and adjusting for what disappears in retirement, their gross annual income need is roughly $90,000, including a healthcare allowance for the bridge from 65 to Medicare. Tom’s Social Security at 67 will be about $36,000 a year. Linda’s will be about $18,000. Combined, they bring in $54,000 a year of guaranteed inflation adjusted income from Social Security alone, starting at 67.
So from 67 onward, Tom and Linda need their portfolio to cover the gap, which is $90,000 minus $54,000, or $36,000 a year. At a 4 percent withdrawal rate, that requires $900,000 of portfolio. But because most of their money is in traditional accounts and withdrawals are taxable, they actually need a bit more, call it $1,000,000. They already have $850,000, so they need to add only $150,000 over the next three years, which is easily achievable at their current savings rate.
For the bridge years between 65 and 67, they have a separate need. They need to cover the full $90,000 without Social Security for two years, plus their healthcare premiums on the ACA marketplace. That requires roughly $200,000 in accessible savings, which they have inside their portfolio.
Tom and Linda can comfortably retire at 65. The calculator that told them they needed another seven years was off by seven years because it gave them a generic answer to a specific question. The right answer for them is closer to $1 million total, almost exactly what they will have.
How Social Security Quietly Cuts Your Real Number in Half
The case above shows how dramatically Social Security can change the math. For Tom and Linda, Social Security covers 60 percent of their needed retirement income. They are not unusual. For a couple where both worked and at least one earned a solid income for 30 plus years, Social Security commonly covers 40 to 70 percent of needed retirement spending.
That changes everything. If your portfolio only needs to cover 30 to 40 percent of your spending instead of all of it, your required portfolio size is two and a half to three times smaller than what the simple 25 times expenses rule would suggest. The rule treats your portfolio like it is doing all the work, when in reality Social Security is doing most of the work for the average earner.
This is also why early retirees, who claim Social Security later and have more bridge years to cover, often need a much bigger portfolio relative to their spending than someone retiring at 65. The Social Security checkbook does not open until 62 at the earliest, and most people are better off waiting until 67 or 70. The bridge years are where the portfolio has to work hardest. (For more on the early retirement bridge specifically, see our piece on Roth conversions and ACA subsidies.)
Case Study: When the Magic Million Is Not Actually Enough
Now consider Rachel, 59, who is recently divorced and starting over. She earns $95,000 as a hospital administrator. She has $1.1 million saved across a 401k and a brokerage account, mostly from her share of the divorce settlement. She lives in a high cost suburb, rents her apartment, and has no pension. Her current spending is $9,000 a month, $108,000 a year.
Rachel reads that $1 million is what you need to retire. She wonders if she could retire now. The honest answer is that she is closer than she thinks, but probably not quite there yet.
Her actual spending will not change much in retirement. She has no commute to lose, no work expenses to cut, no kids to subsidize. Healthcare costs will go up significantly because she will need to buy ACA coverage for the gap years before Medicare. Call her annual need $115,000 in retirement.
Rachel’s Social Security at her full retirement age of 67 will be about $32,000 a year. That leaves a gap of $83,000 a year that her portfolio needs to cover from 67 onward. At a 4 percent withdrawal rate, that requires roughly $2.1 million, not the $1 million she has read about. And from 59 to 67, she would need to cover the full $115,000 a year from her portfolio without Social Security, which requires another buffer on top.
Even if Rachel reduces her spending to $90,000 a year, which would mean moving to a lower cost area or making other lifestyle changes, her required portfolio is around $1.5 million, still meaningfully above her current $1.1 million. The magic million gives her a false sense of being ready when she is realistically four to six more years of saving away from her real number.
This is the failure mode in the other direction. The simple rules can tell you that you have enough when you do not, just as easily as they can tell you that you do not have enough when you do.
Why the 4 Percent Rule Is a Starting Point, Not an Answer
The 4 percent rule comes from the Trinity Study, which looked at historical market data and found that a 4 percent withdrawal rate, inflation adjusted each year, had a high probability of not running out of money over a 30 year retirement. It is a useful starting point, but it has three big problems when used in isolation.
First, it ignores taxes. Withdrawing $40,000 from a traditional 401k generates $40,000 of taxable income. Withdrawing the same $40,000 from a Roth generates zero taxable income. The 4 percent of portfolio can mean very different things depending on where the money is coming from. A $1 million portfolio that is all traditional might only deliver $32,000 of actual spendable money after federal taxes. A $1 million Roth portfolio delivers the full $40,000.
Second, it assumes constant spending. Real retirement spending follows a pattern that is heavier in the early years (travel, hobbies, discretionary spending), lighter in the middle years, and then often heavier again at the end as healthcare and long term care costs rise. The 4 percent rule averages all of this into one constant number, which is not how anyone actually lives.
Third, it does not account for income sources that start or stop mid retirement. Social Security starting at 67, a pension starting at 65, RMDs starting at 73, a part time job ending at 70, all of these change the picture year by year, and a flat 4 percent withdrawal does not adapt.
The 4 percent rule is fine as a rough sanity check. It is not fine as the actual plan.
Case Study: The Bridge Year Problem Most Early Retirees Miss
Karen and James, both 51, want to retire next year. They have saved aggressively, $1.8 million between them. Their current spending is $80,000 a year. By any simple rule, they are set. $1.8 million times 4 percent gives $72,000, plus Social Security at 67 brings them well above their need.
But Karen and James have a bridge problem the simple rules do not see. They are 16 years away from Social Security and 14 years away from Medicare. For the first 14 years of retirement, they pay full ACA premiums and they are drawing down portfolio at a rate that means more than 4 percent in the early years to cover healthcare. If they assume $25,000 a year of healthcare costs on the marketplace, their bridge year spending is closer to $105,000, which is almost 6 percent of their portfolio annually.
That 6 percent rate is not necessarily fatal, but it eats their portfolio fast in the years when they are most exposed to a bad sequence of market returns. If the market drops 30 percent in their first three years of retirement, withdrawing 6 percent a year on top of that can permanently impair their plan.
The right answer for Karen and James is not necessarily to keep working. It is to plan more carefully. They might delay one year to add another $200,000 of cushion. They might reduce spending specifically in the bridge years. They might shift toward part time consulting income for a few years to reduce withdrawals during the risky window. None of these decisions can be made from a generic “you have enough” calculator. They all require looking at the specific shape of their spending year by year and matching it to their actual income sources.
How to Actually Calculate Your Retirement Number
The right framework, if you want one, is to throw out the rules and answer three questions in order.
The first question is what you actually spend in a typical year. Not your gross income, not your take home pay, but your actual spending. Pull a year of bank and credit card statements and add it up. Most people are surprised at how different this number is from what they thought it was.
The second question is what changes in retirement. Subtract what goes away. Savings contributions, payroll taxes, work clothes, lunches out, the second car you sell when you no longer commute, your mortgage if you have paid it off by then. Add what comes back. Higher healthcare costs especially if you retire before 65, travel and hobbies in the first decade, eventually long term care planning. The difference is your real retirement spending number.
The third question is what is already covered. Estimate your Social Security at your planned claiming age from the SSA’s online calculator. Add any pensions, rental income, annuities, or part time income you actually plan to have. The remaining gap between your spending and your covered income is what your portfolio needs to fund.
Multiply that annual gap by 25 if you want a quick check using the 4 percent rule. Multiply it by 30 or 33 if you want to be more conservative or if you are retiring early and need to bridge to Social Security. Then adjust upward by 20 to 30 percent if most of your money is in traditional accounts, because taxes will eat that portion of your withdrawals.
That is your real retirement number. It might be lower than $1 million, or it might be higher than $2 million, but it will be specific to you, not to a generic rule built for someone you have never met.
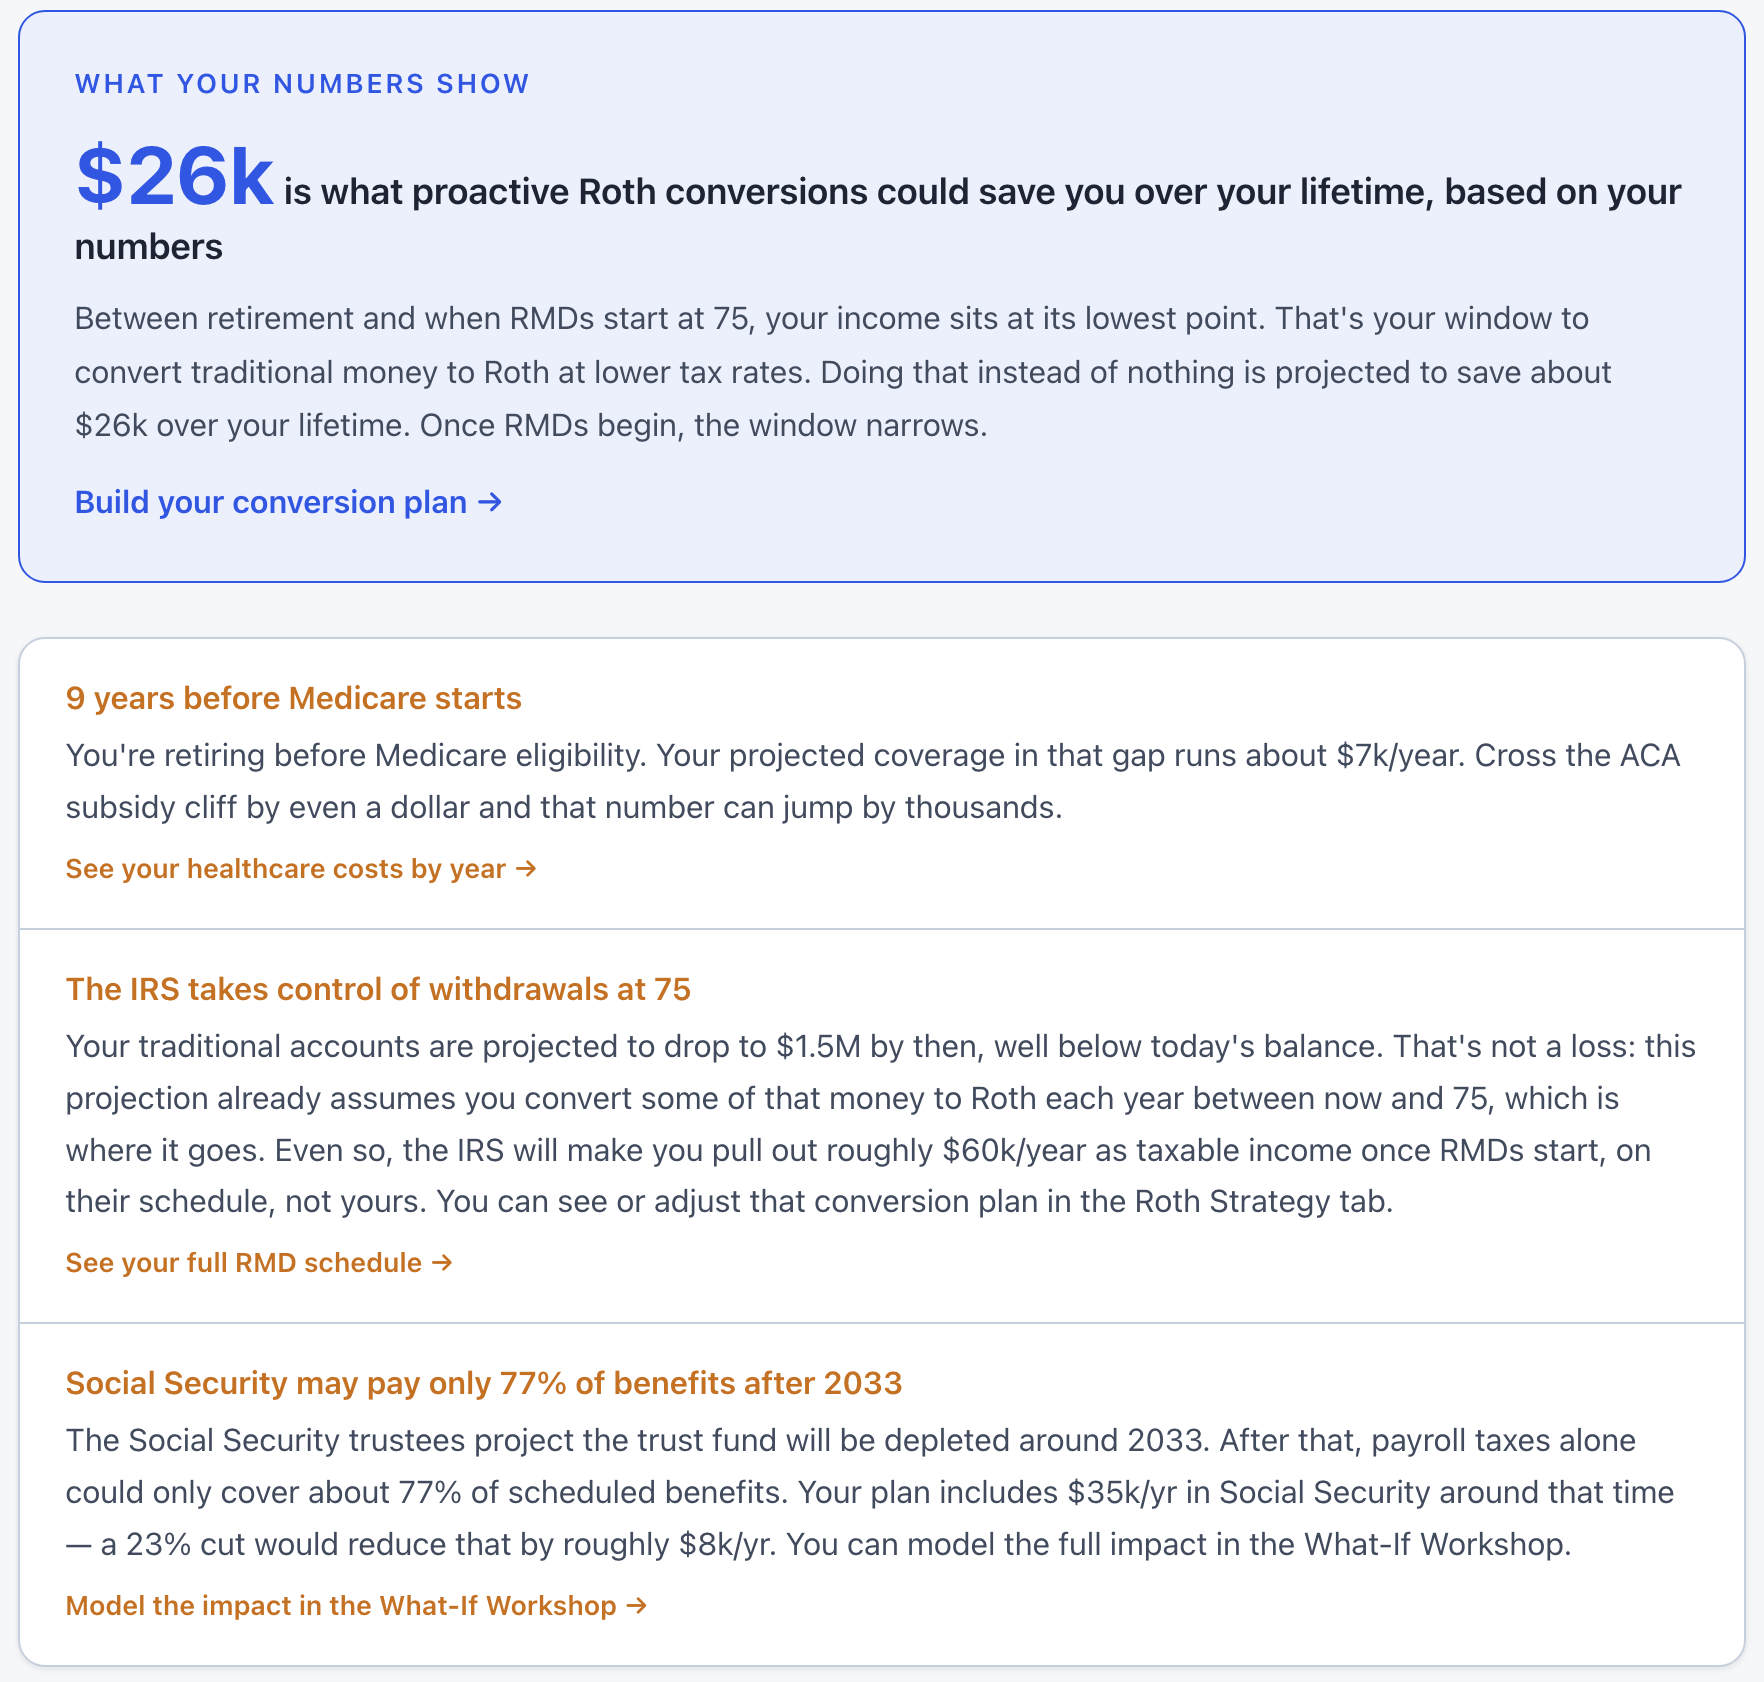
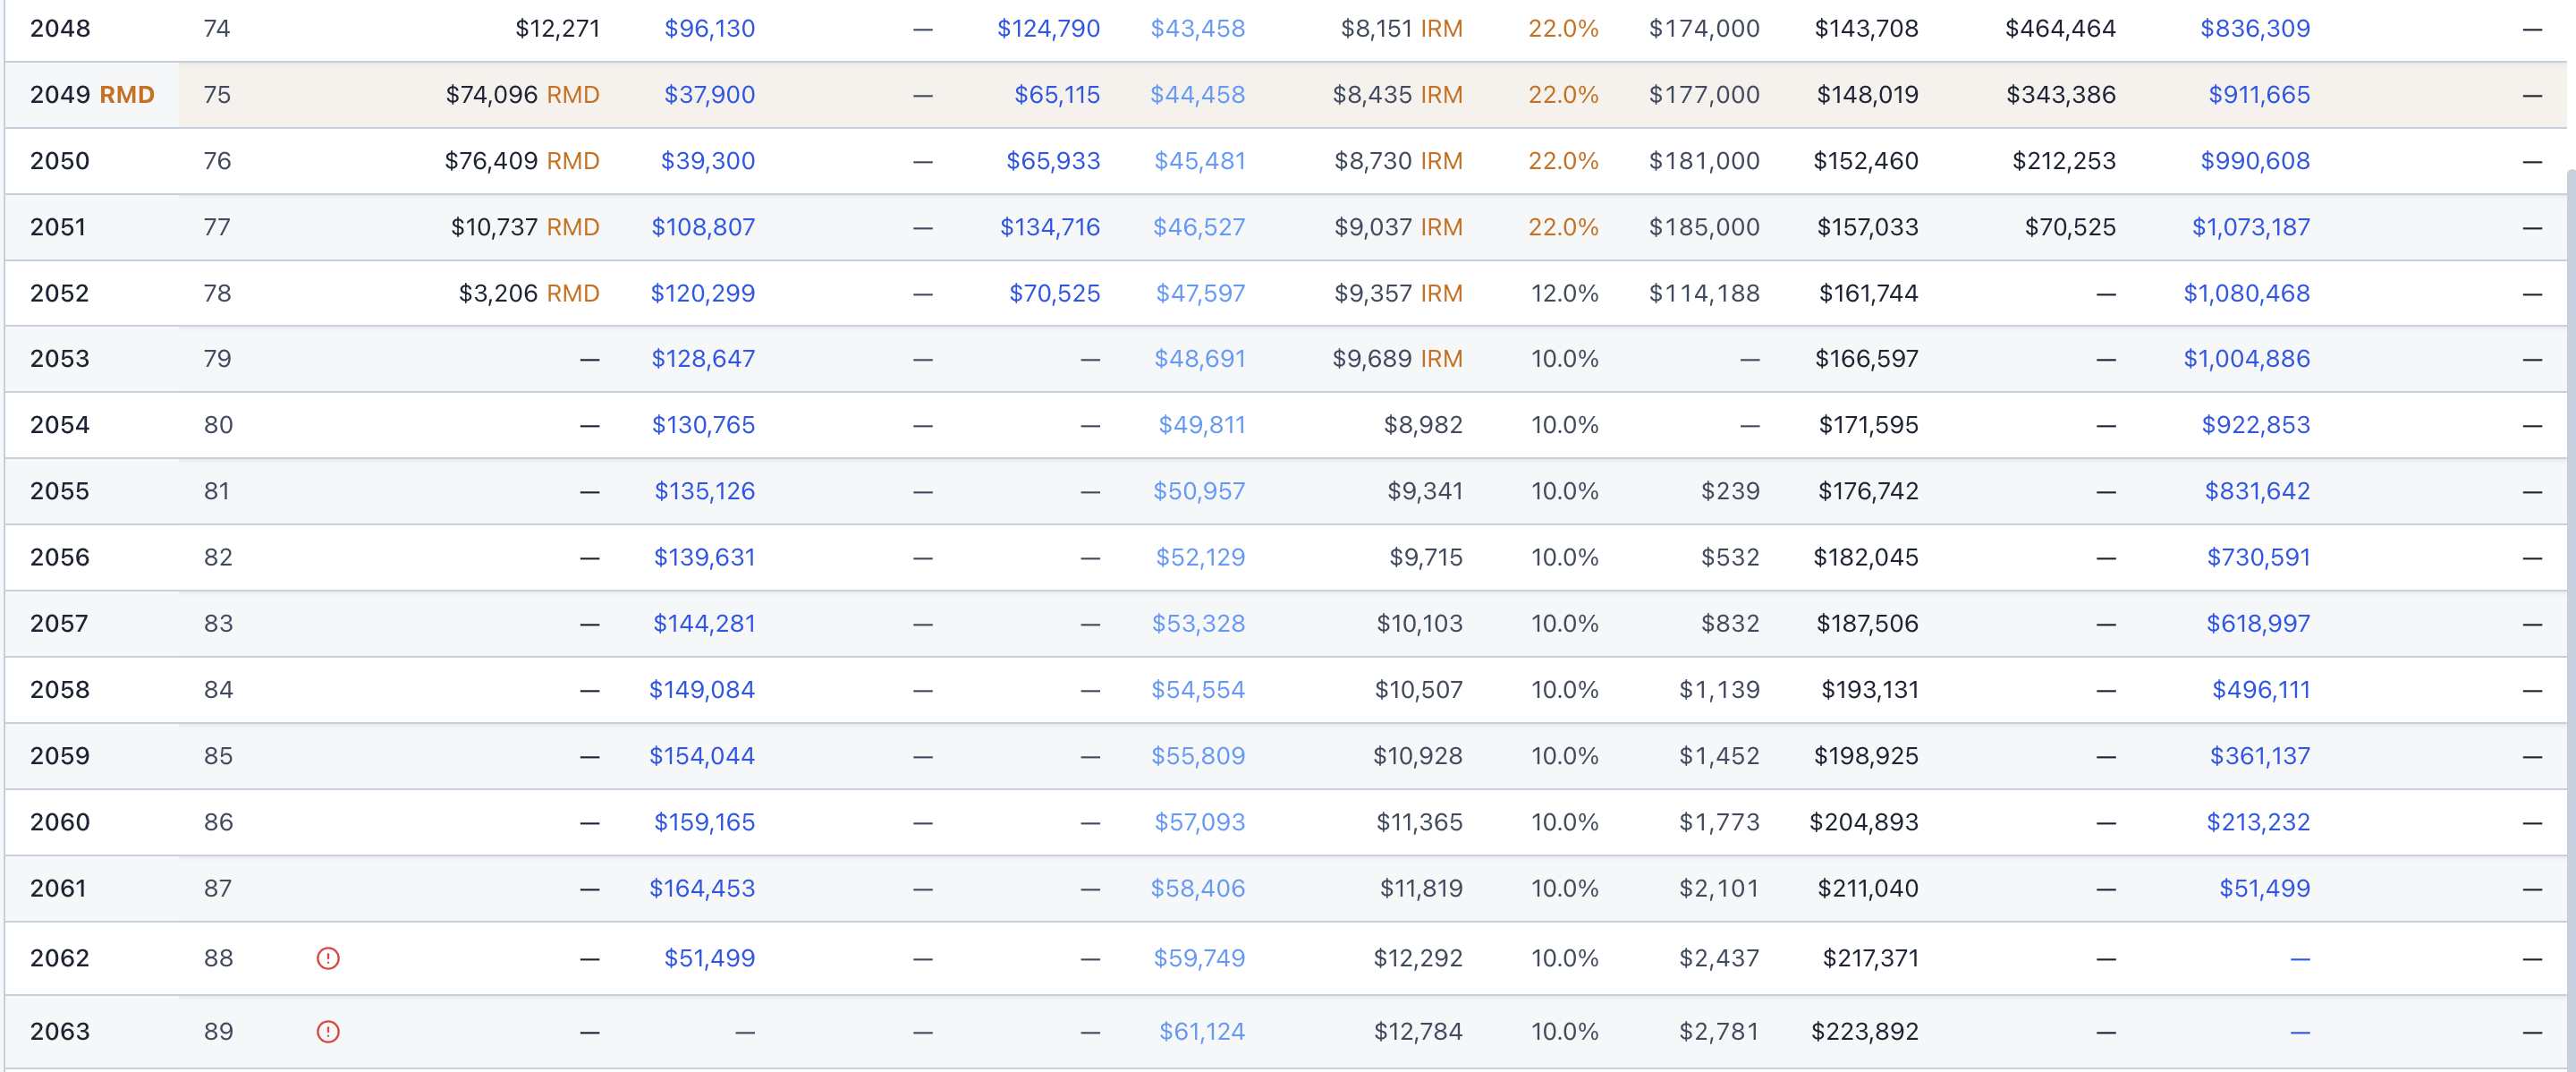
ThunderHarbor’s planner does this whole calculation with your actual numbers, including the Social Security and tax pieces that most simple calculators leave out. It also shows you what happens if you retire one year earlier, or two years later, or downsize your house, or move to a state with no income tax. The answer to “do I have enough” is almost always more nuanced than the rules suggest, and seeing the year by year picture is the difference between a guess and a plan.
Not financial advice
This article is for informational purposes only. Nothing here constitutes financial, tax, or legal advice. Social Security rules, tax brackets, and healthcare costs change from year to year. Always consult a qualified professional before making significant financial decisions.
Calculate your actual retirement number
ThunderHarbor models your real spending, Social Security, taxes, and portfolio growth to show exactly when you are ready and what happens if you are not.
Start your free plan